This post announces the new profiling mode for sydtest with which you can find out why your test suite is slow.
One of the test suites for Social Dance Today contains 341 test. Each of those may run purely, use a clean database, or spin up a real server with a clean database. Yes sydtest shows the timing already for each test, colour coded, even, but it can still be difficult to find out which tests are worth trying to optimise.

Profiling mode
Sydtest 0.14 adds a profiling mode which you can activate by passing --profile to your test suite. It prints a sorted list of tests by their individual runtime at the end of the test report:
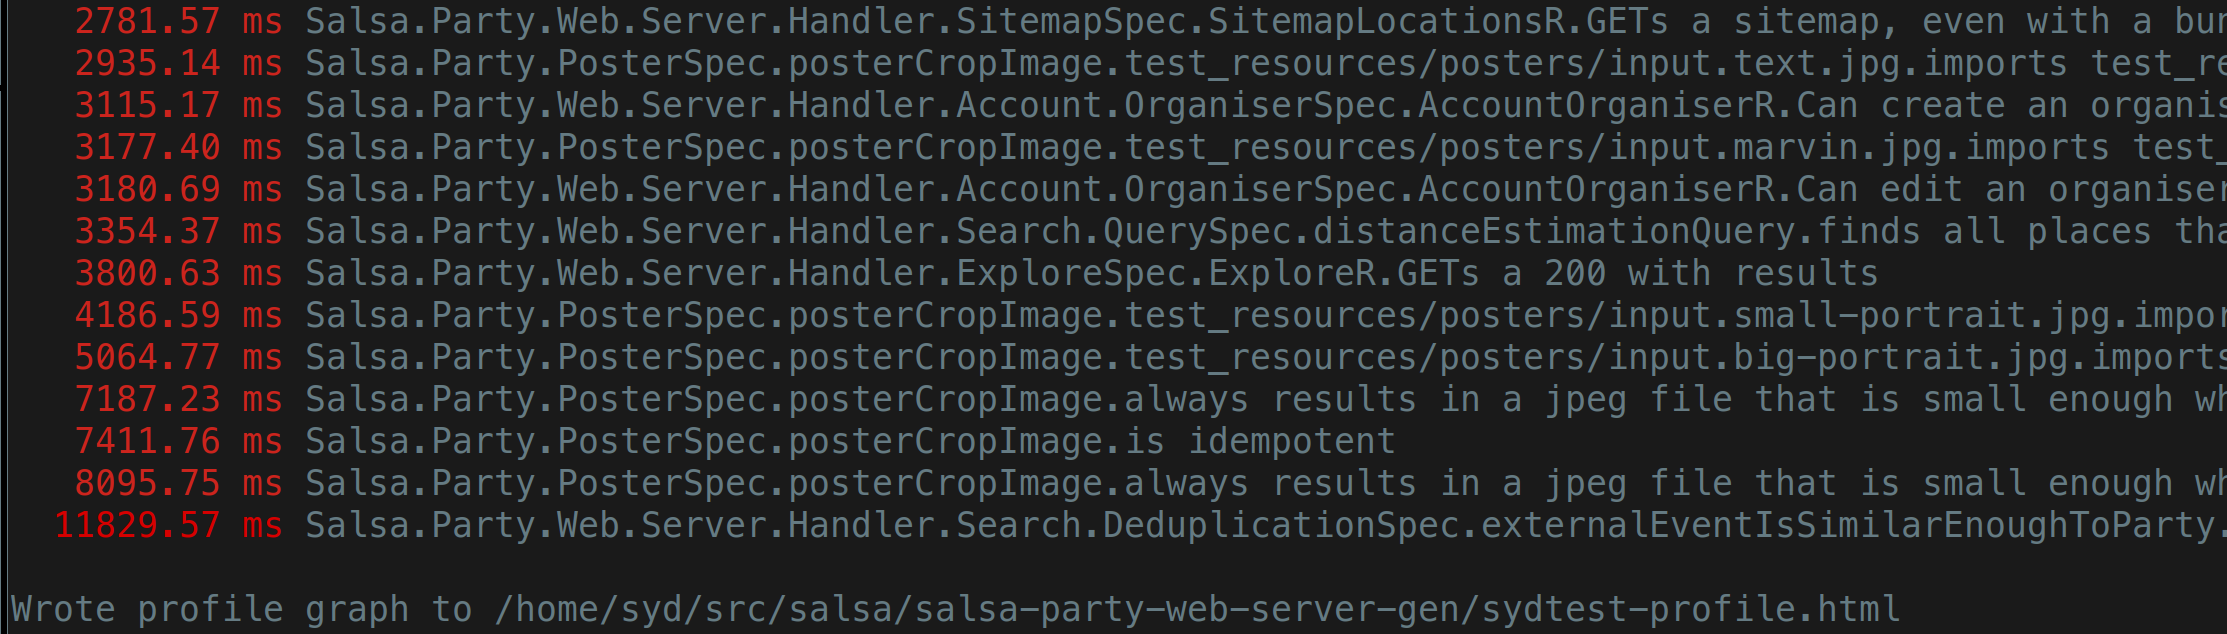
As you can see at the end, an interactive report is also generated.
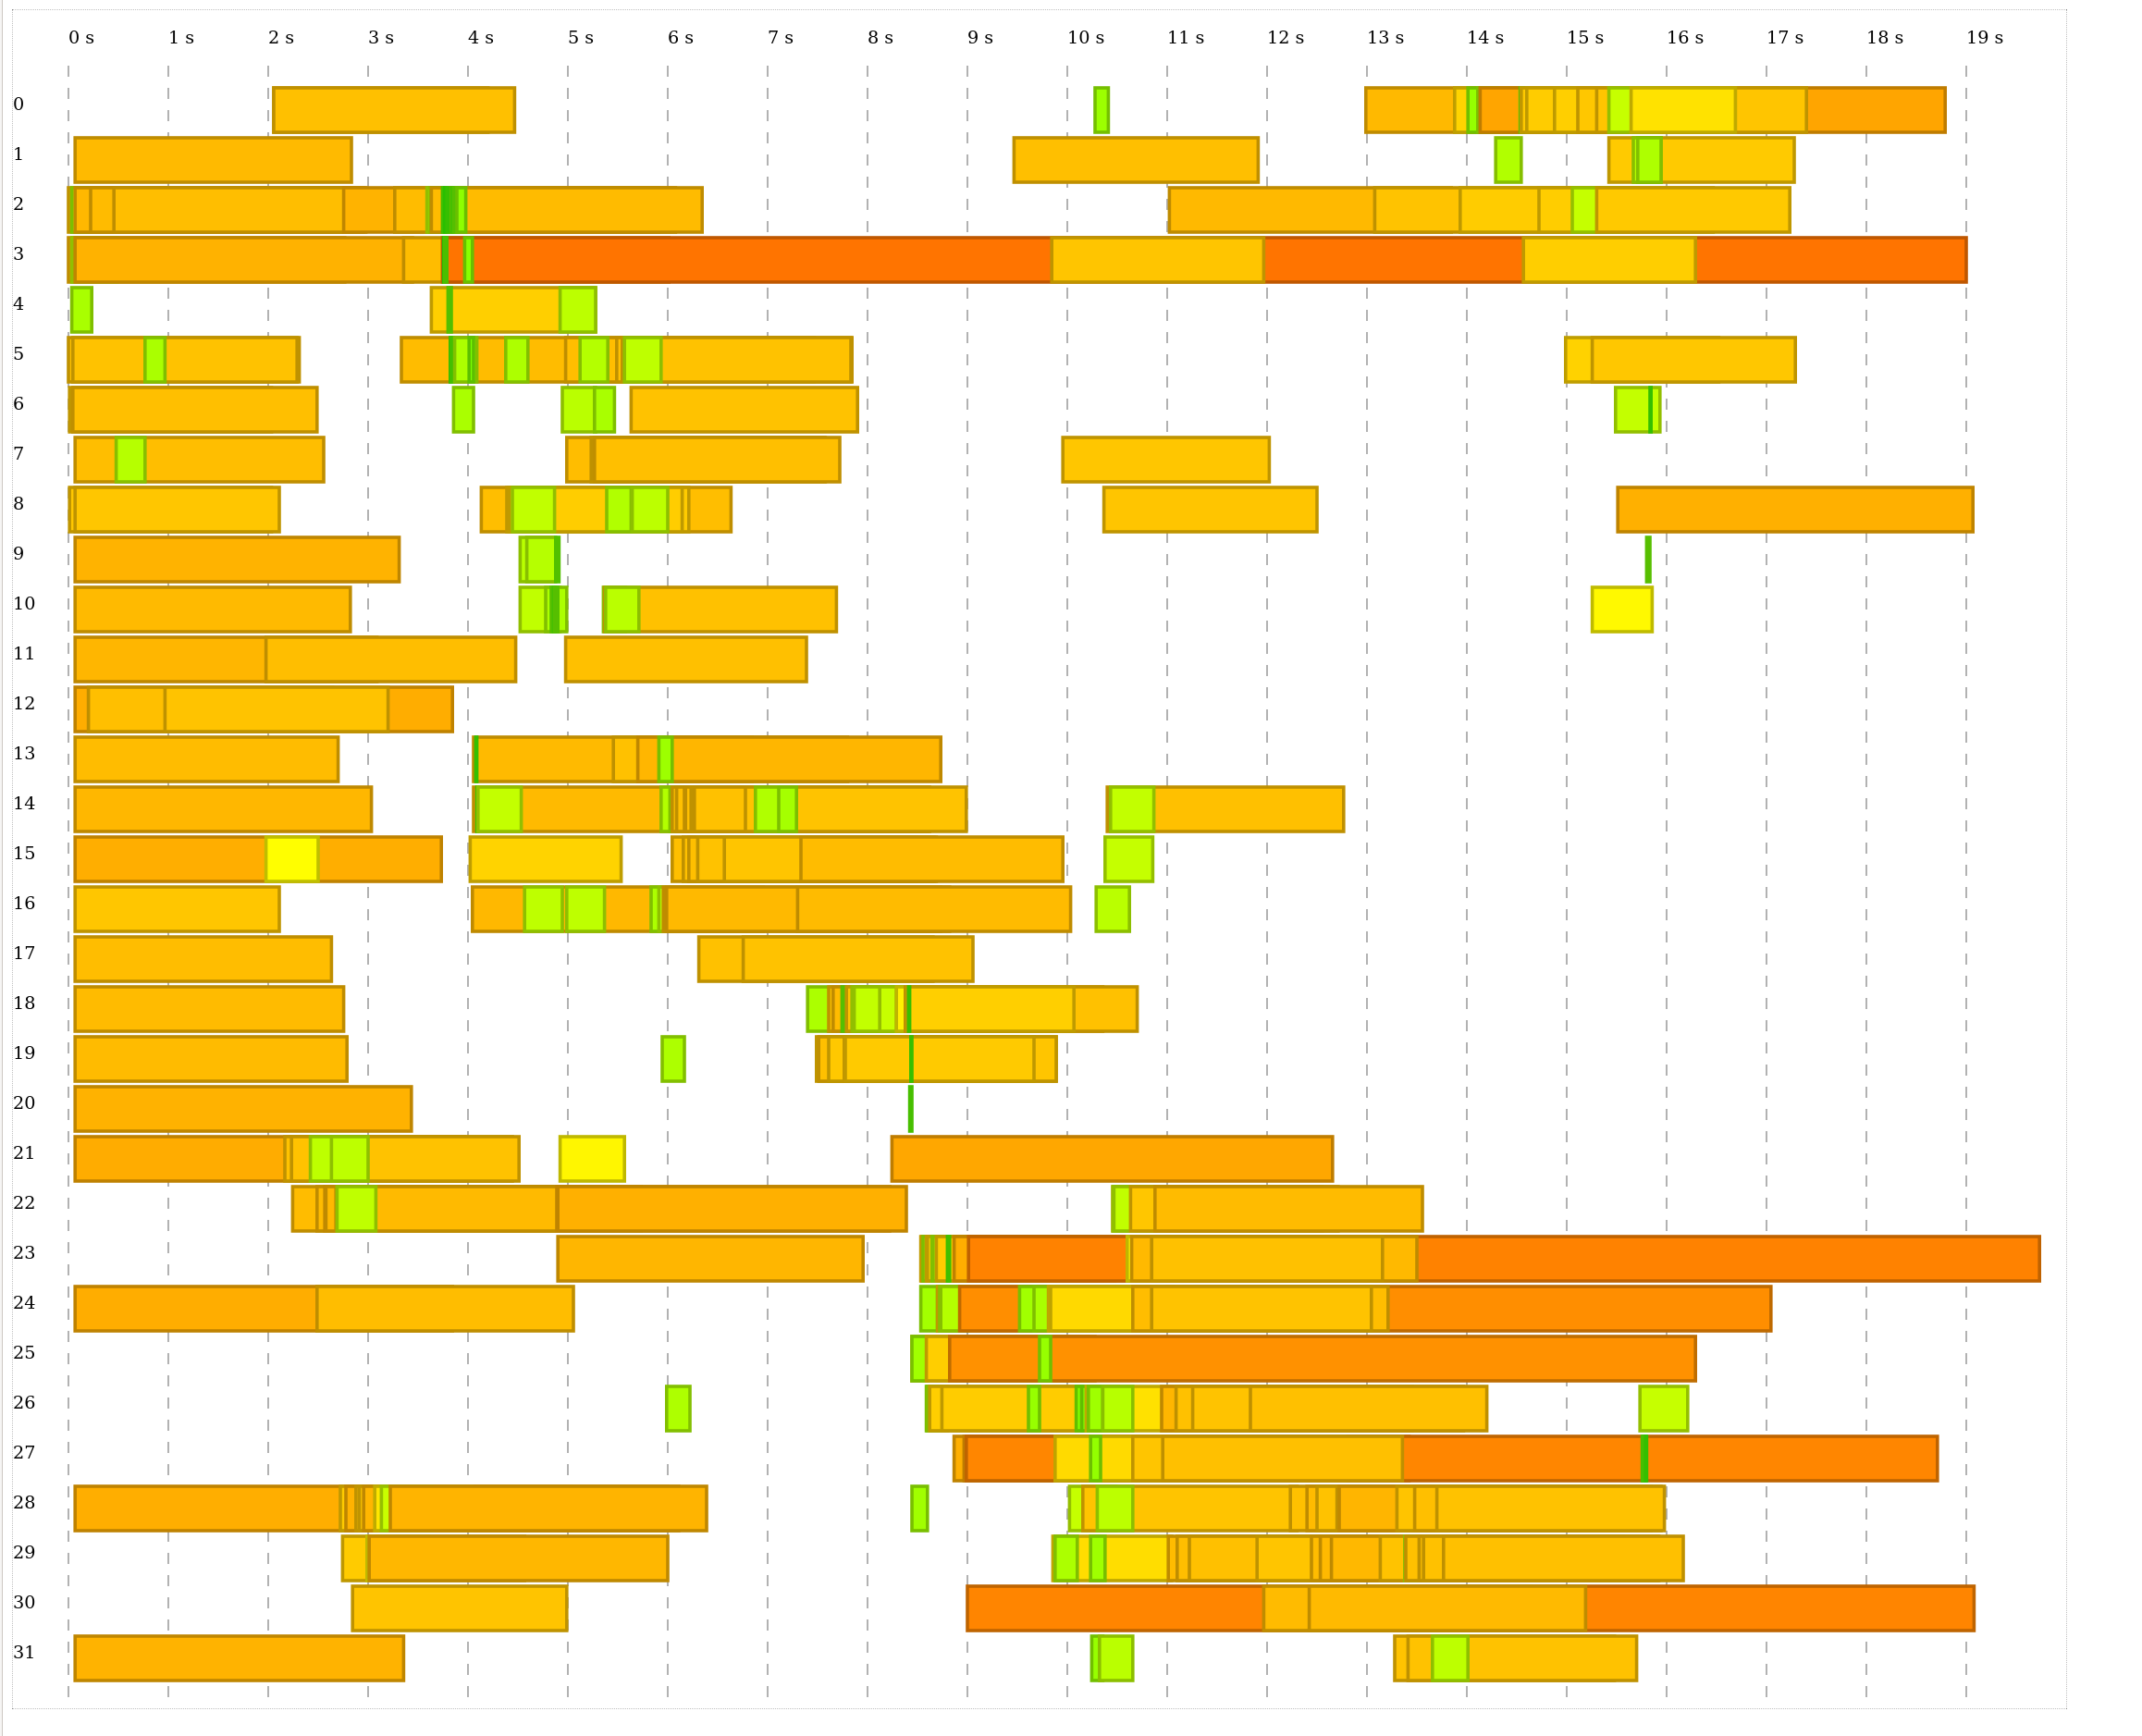
Here you see each test represented as a horizontal bar. The colour and width of each bar are indicative of the runtime of the individual test. Vertically you see the different cores that these tests run. You can mouse over every bar to see which test it is and how long it took precisely.
Runner improvements
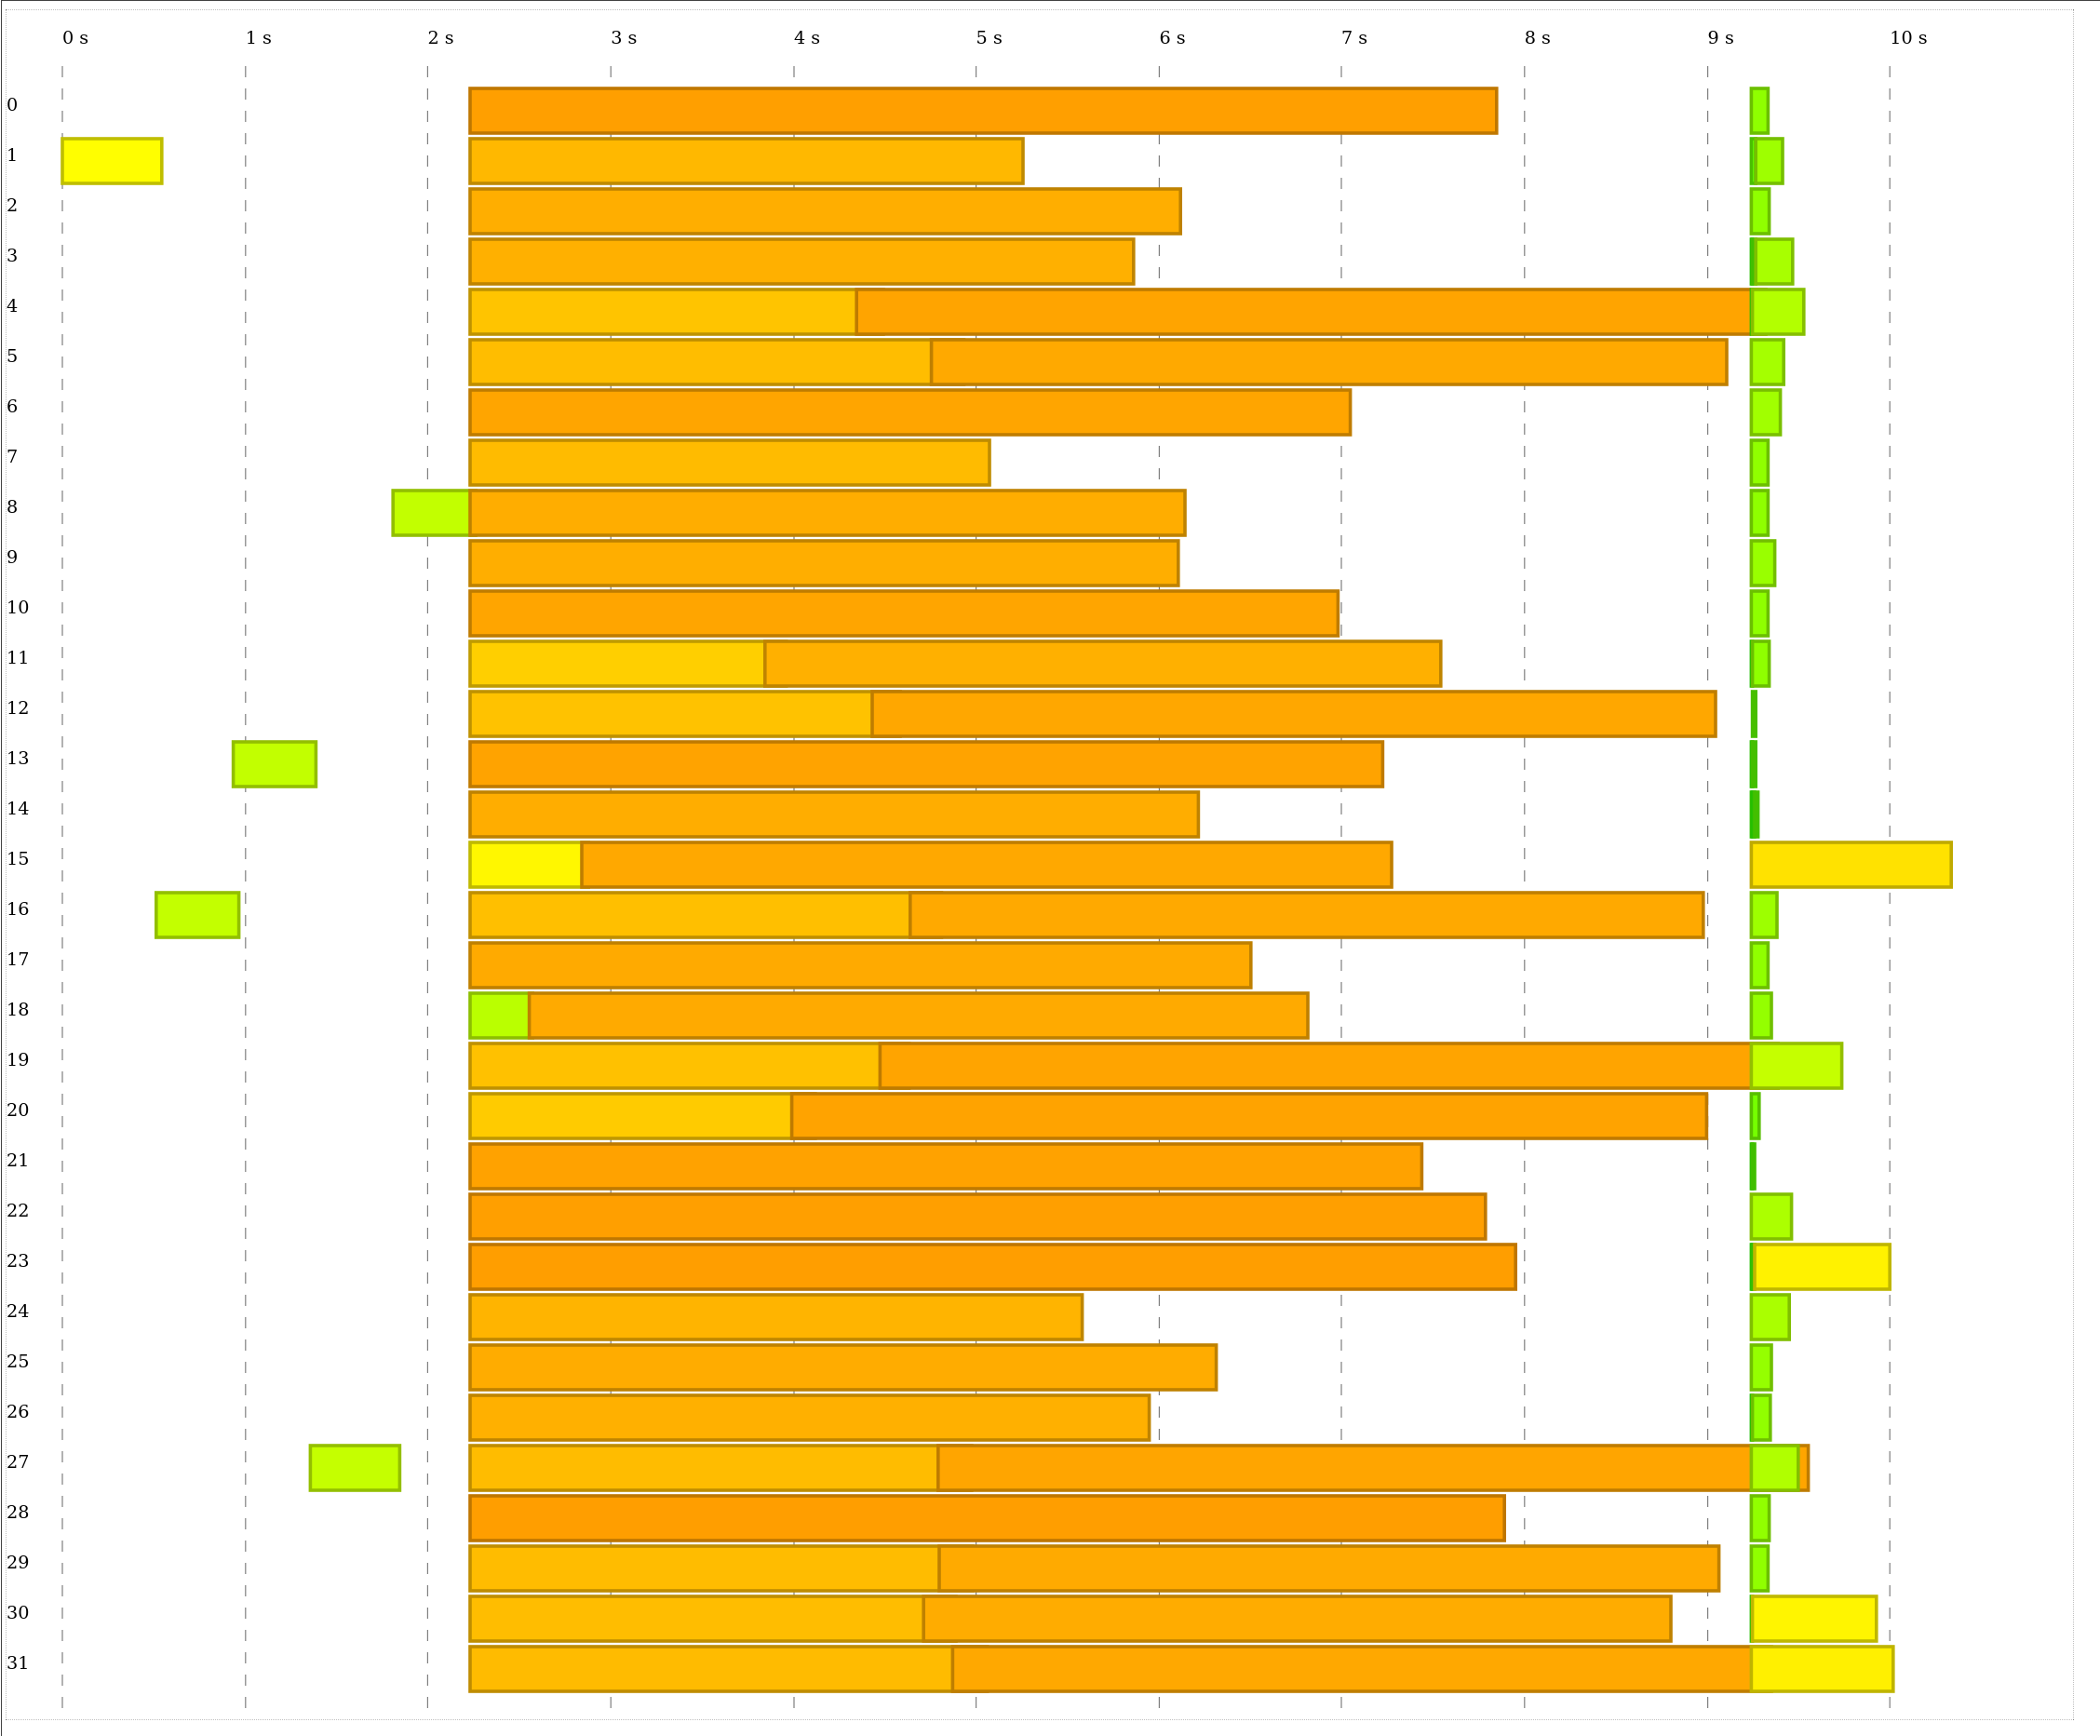
The above report is from when I first implemented this profiling mode. As you can see by all the whitespace between the bars, there was a lot of improvement for the test runner.
I changed the test runner to take more advantage of all the cores of my machine:
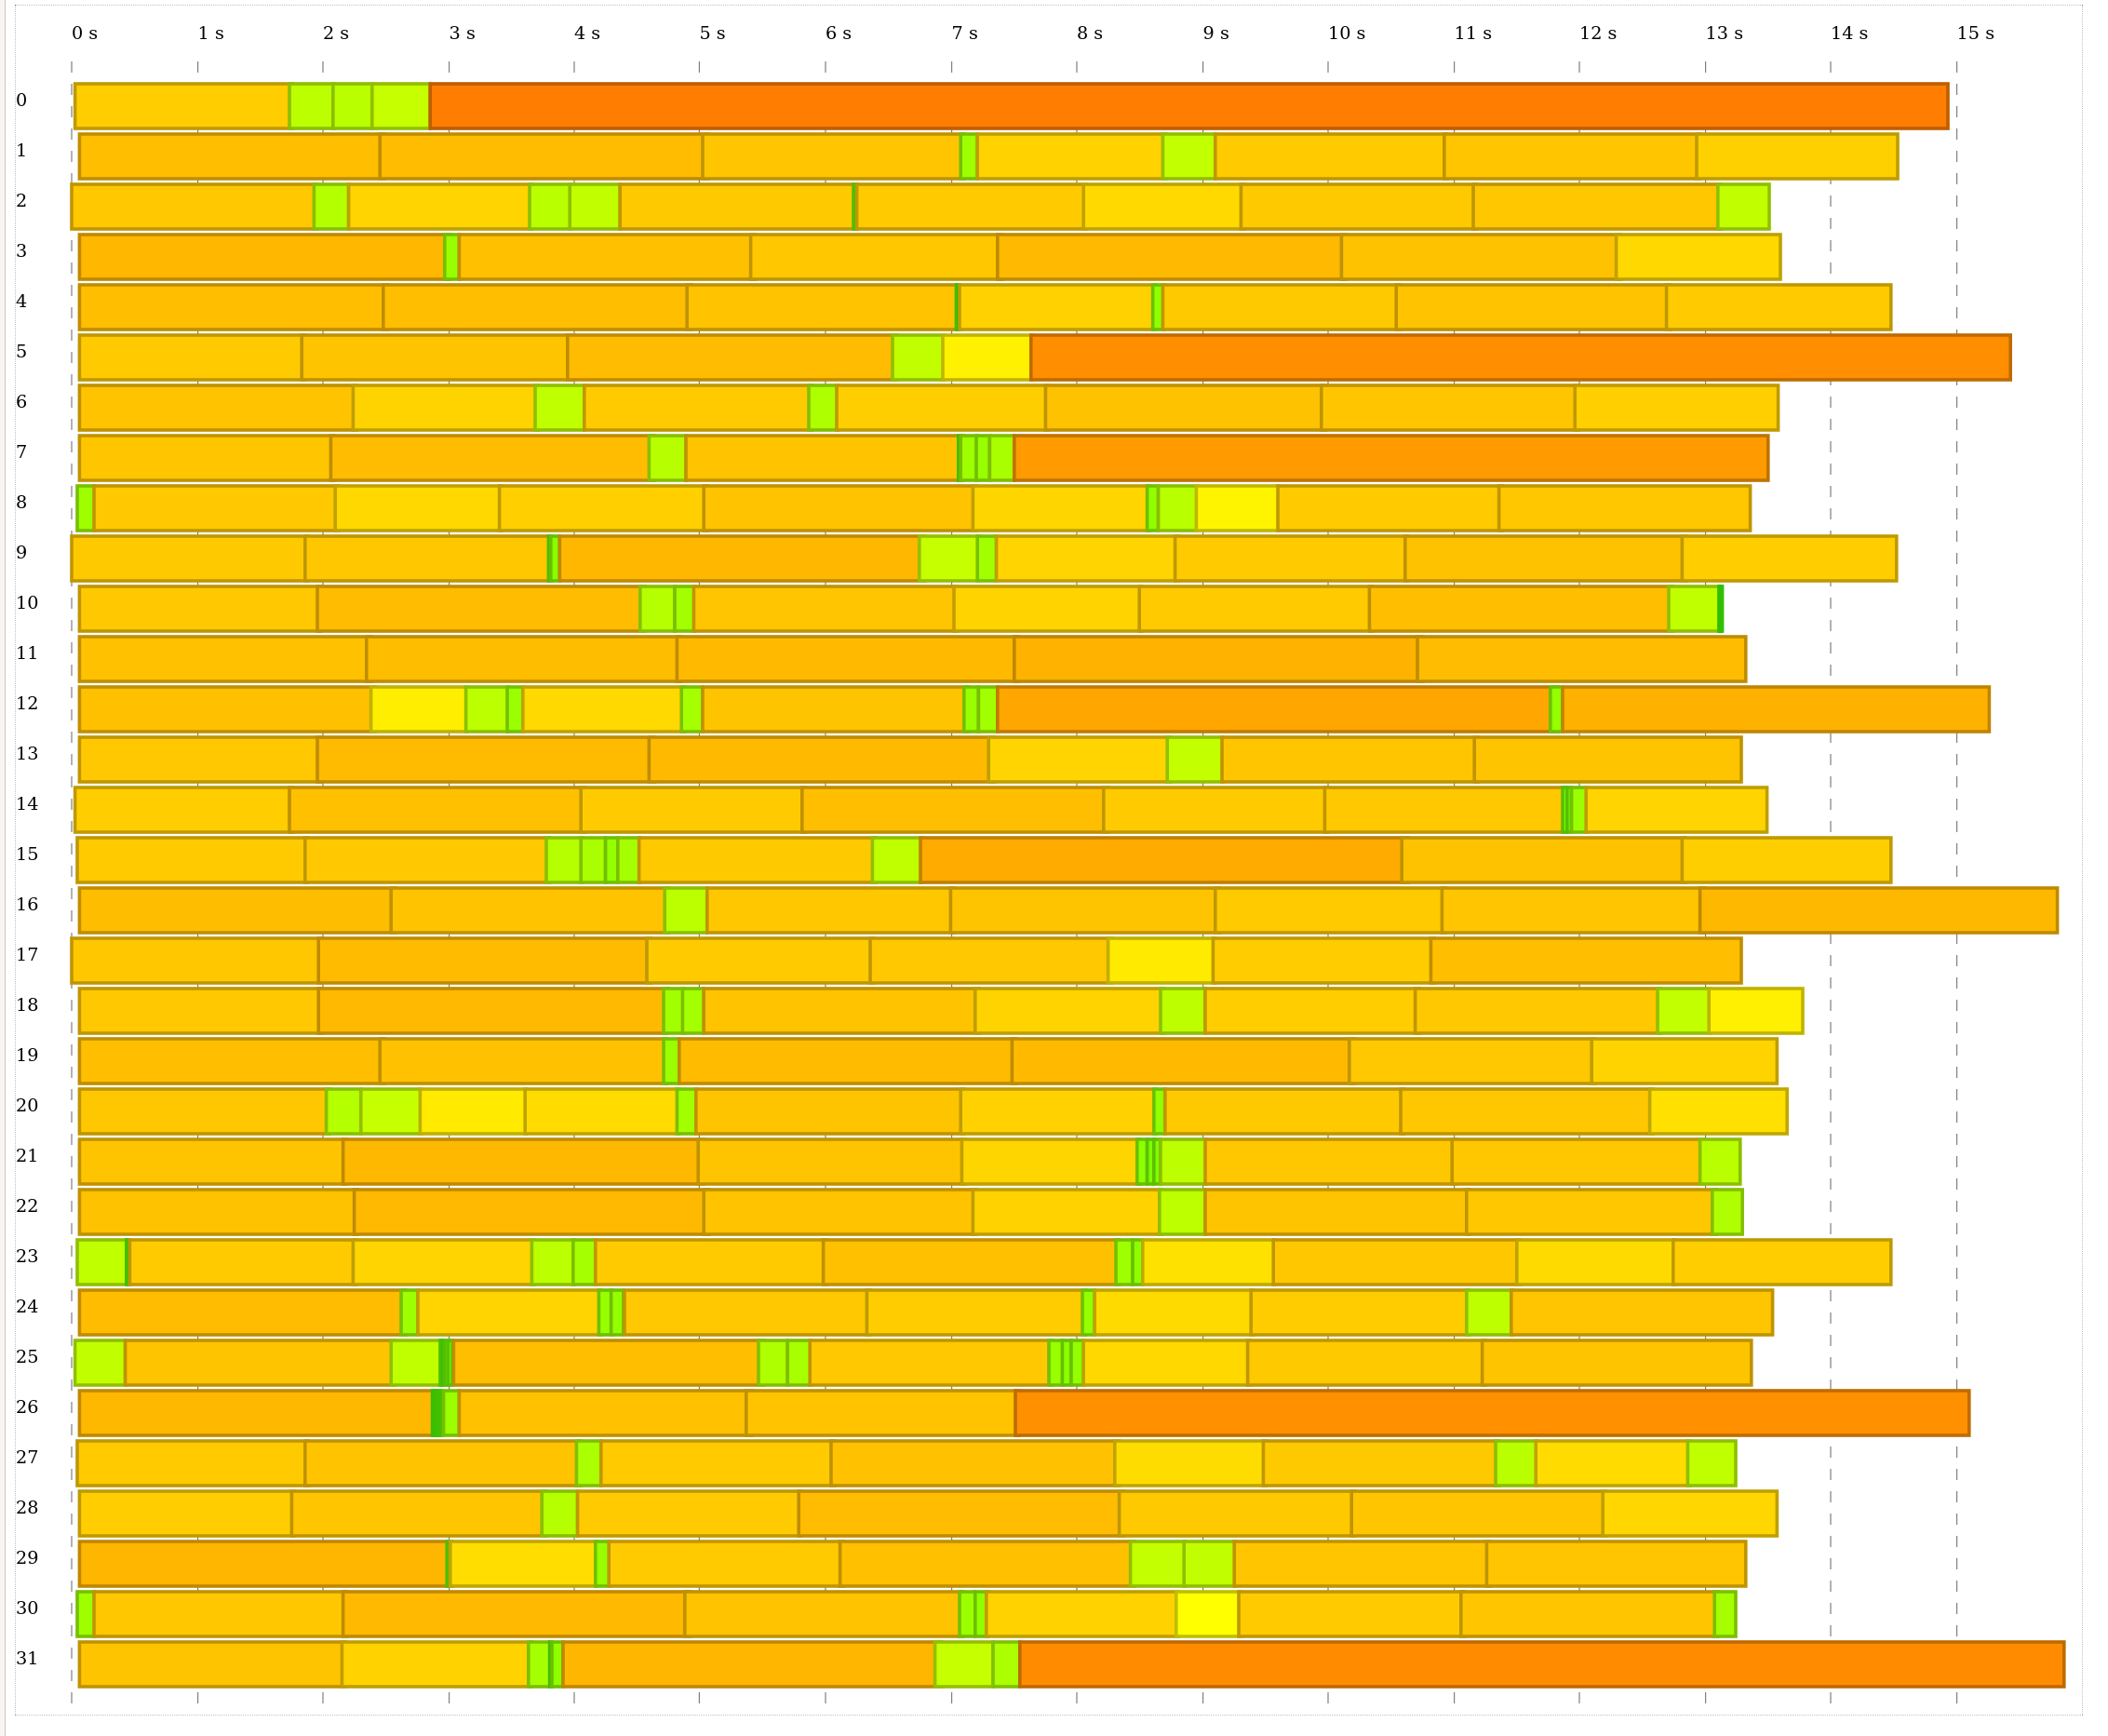
Here you can really see how amazingly parrallelisable tests can be if you've solved test pollution. You can also immediately see which tests could potentially be improved: the long dark orange ones. In particular, the very long test at the top took 12 seconds!
(Note that all the profiles you see in this blog post are of real test suites. None of them are "just" contrived examples.)
Digging into profiles
Long tests
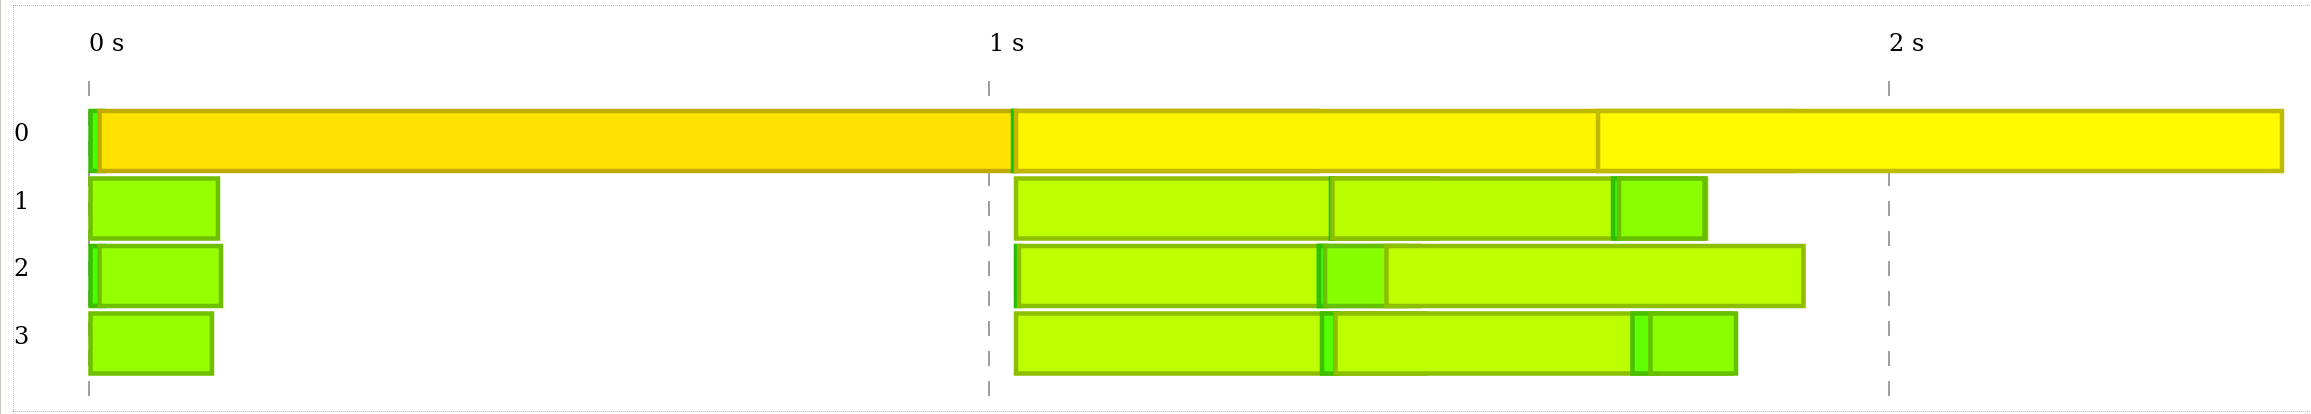
Here is an example of a profile in which it is really easy to see how the test suite runtime can be im(proved:
There is one test that takes much longer than the others, and the total runtime of the test suite is only a bit more than the run time of that test. If we were to speed up this test to less than three quarters of a second, then the entire test suite would complete almost two seconds faster.
In a fully parrallelisable test suite, the total runtime of the test suite will be close to the runtime of its longest test.
Sequential
In the above case it was easy to see where to look, and the textual report would have pointed you the right way, but there are also cases in which speeding up the slowest test is not the most impactful thing you could be doing.
Here is another example of a profile, this time of sydtest's own test suite (with --jobs 4):
As you can see, the test suite is taking longer than it looks like it could be. However, just making the longest test take less time would actually not help so much in this case. This is because the test suite is not taking full advantage of all the available cores. Indeed, the very small green test in the middle of this graph is actually the problem. This test is marked as sequential, which means that no other tests may be running at the same time. This means that the test suite has to wait for any long test to finish before starting it, and also not run any other tests at the same time either.
In this case the most effective option for improving the overall test suite's runtime would be to find a way to not require sequential for this test.
Here is another test suite that shows this problem nicely. Again, note that the problem isn't the tests that take very long, but the tests that need to be run one by one:
The rule of thumb is that using sequential is disastrous for test suite performance but it is the default for most testing frameworks.
Beauty
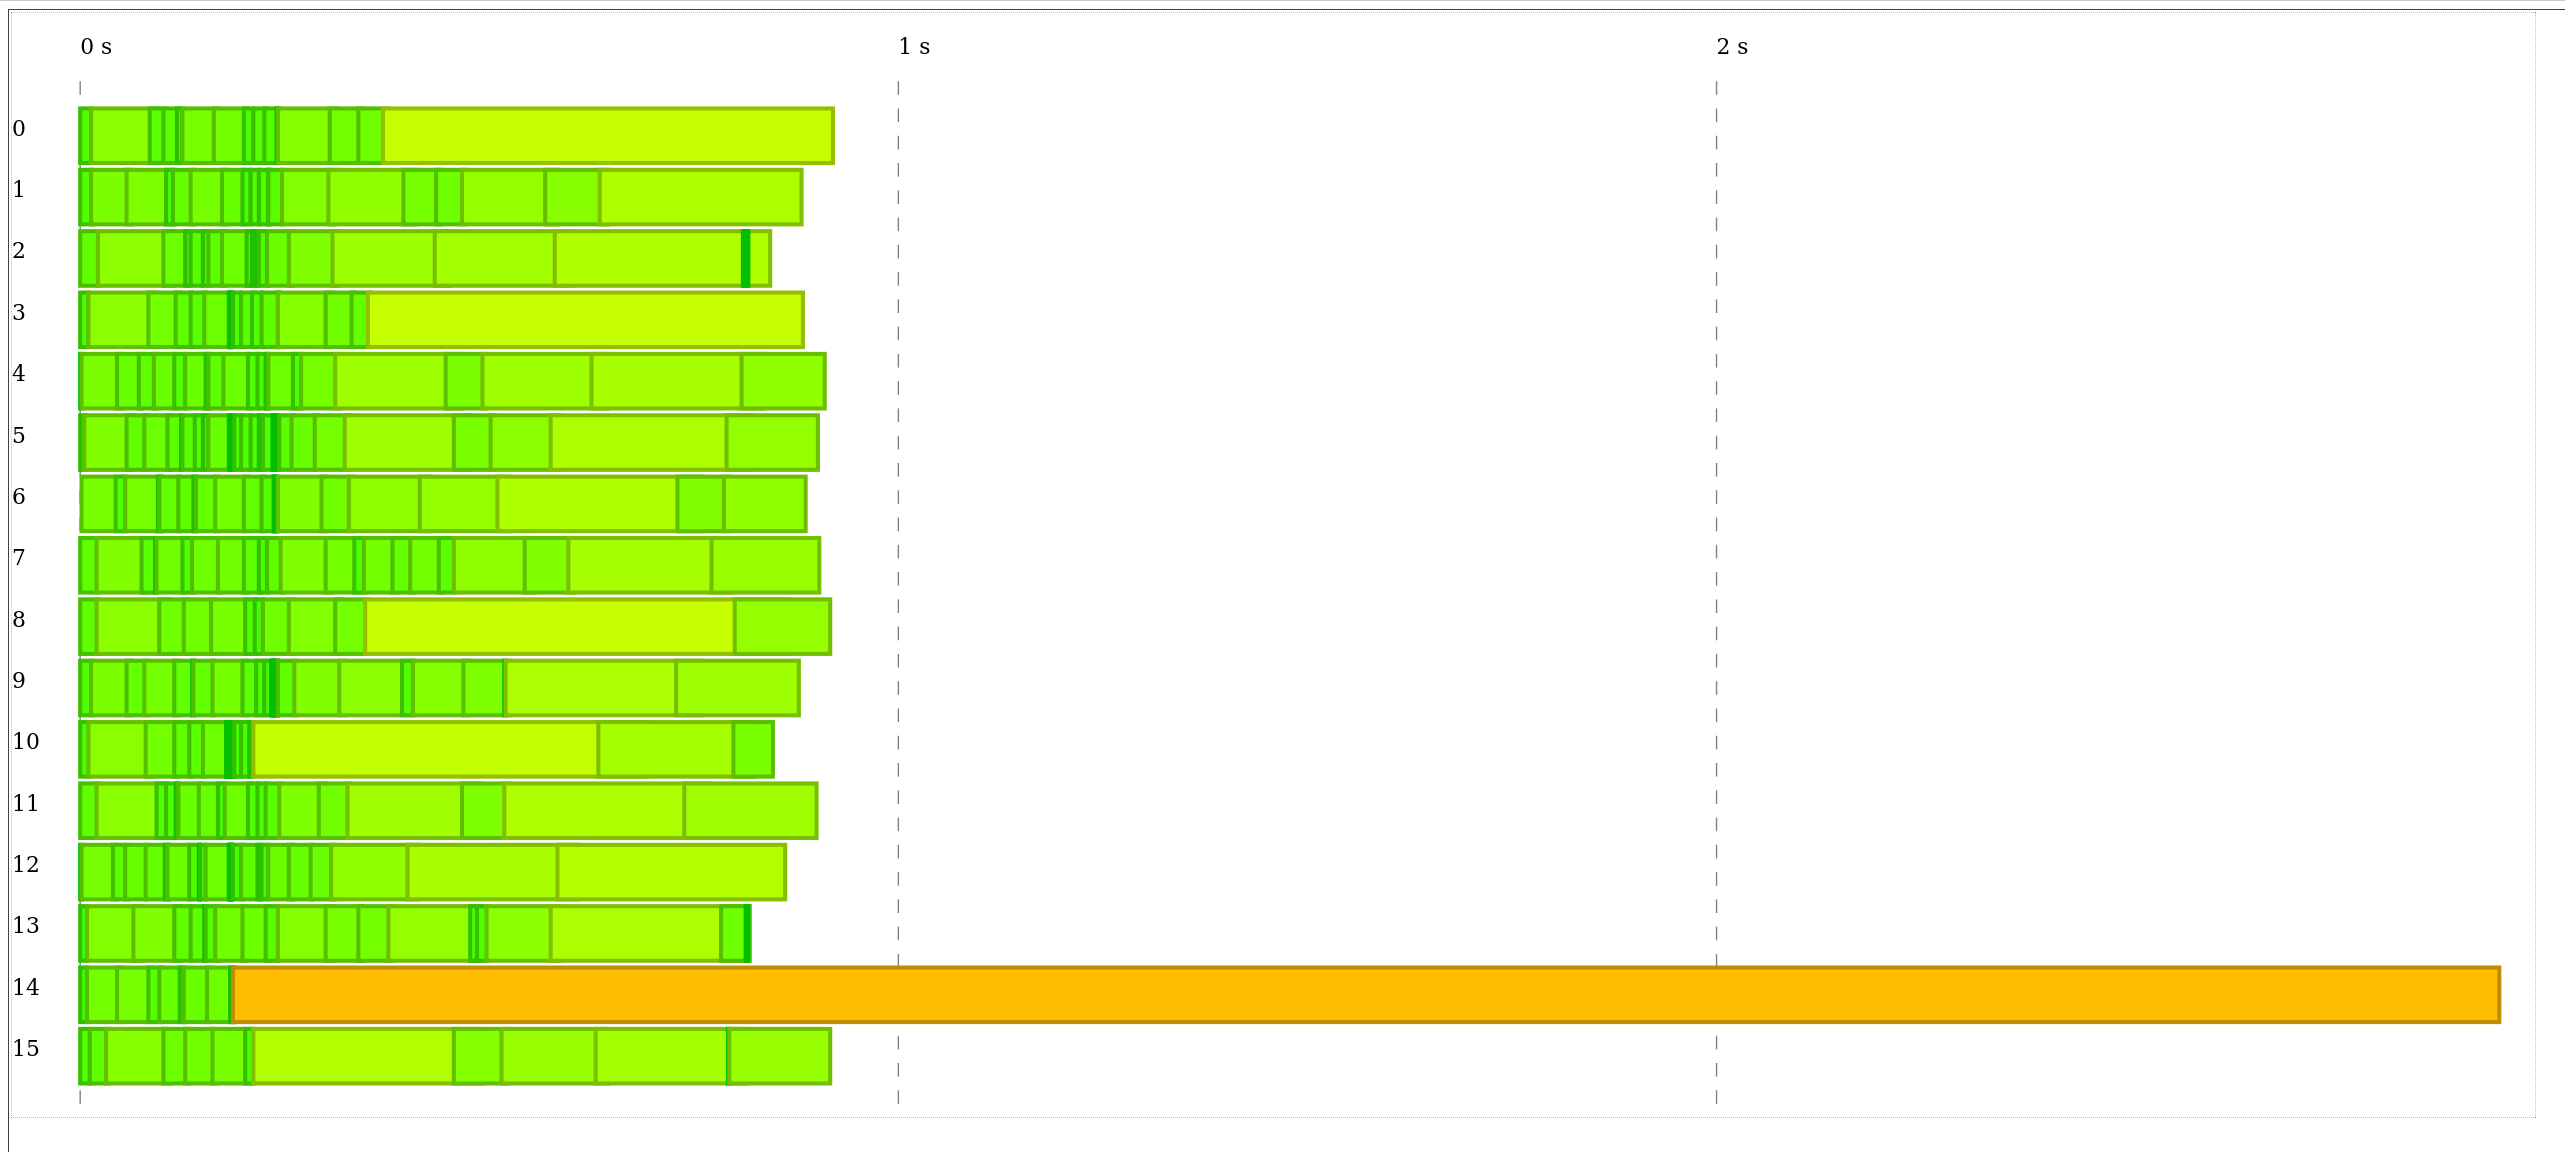
To finish off this blog post, I'd like to show you what a great test suite's profile could look like:
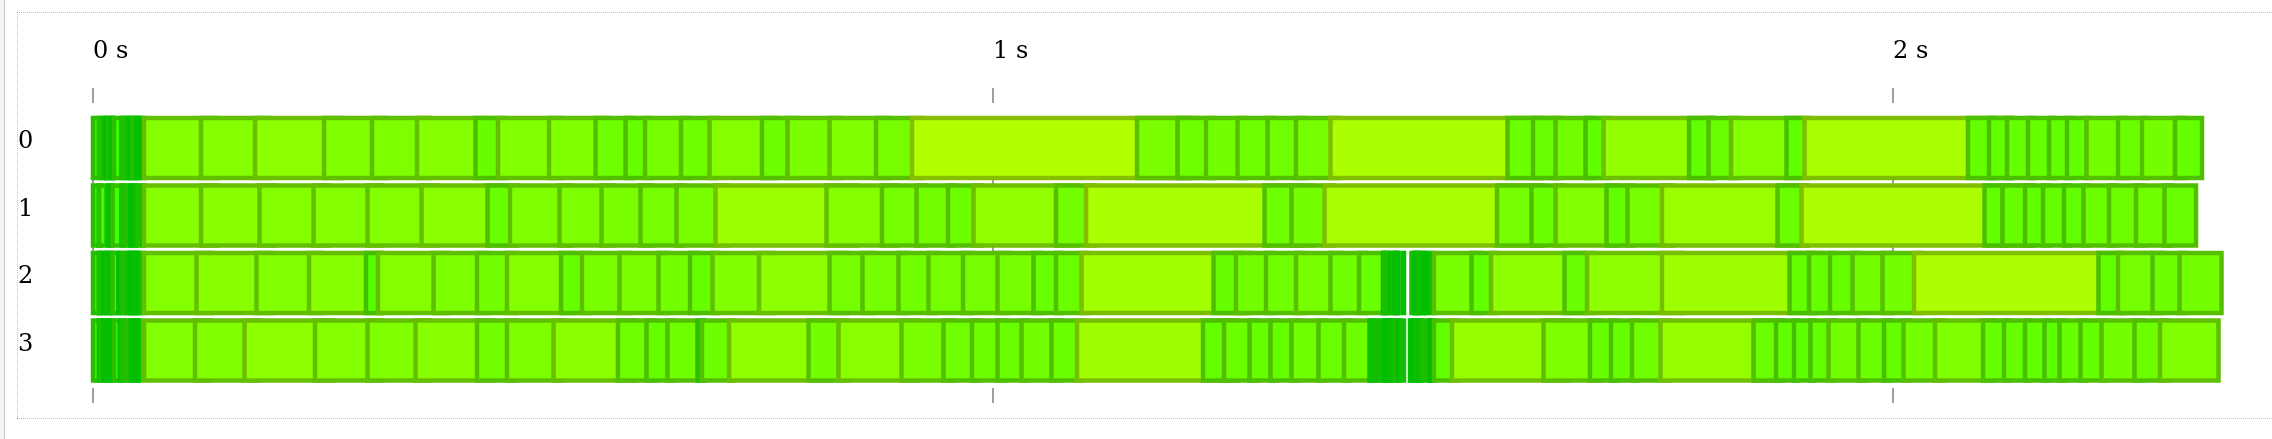
Here you see really-safe-money's test suite running over 700 tests (over 1.6million examples) in under 3 seconds.