This is the story of a space leak in the Social Dance Today server and how we fixed it.
Symptoms
A few months ago, I suddenly got a bunch of alarm emails saying that my site (the one you're reading this on) had gone down. I was about to teach our dance class at the time, so I quickly logged into the AWS console and restarted my server in the hope that that would fix it. I figured that if that fixed it, I could diagnose the problem later. If not, then it wouldn't have hurt because the server was down anyway.
The server rebooted nicely and all my sites were up again. (That server runs all of my services, including Intray, Tickler, Smos, this site, and of course Social Dance Today, because I'm really cheap when it comes to cloud services.)
Diagnosis
CPU credits
The next day, I logged into the AWS console again and looked at the monitoring section of the aws instance. The CPU credits graph showed me that I'd run out of CPU credits. That's when I learnt about what AWS' CPU credits were. If you don't know what they are, here's a summary:
When you rent an EC2 instance, you don't actually get all of the CPU power that they have all the time. Because AWS expects you to let your CPU's idle for most of the time anyway, they only charge you for the expected baseline usage. This works by letting you accumulate CPU credits when your instance's CPU usage is below the baseline, and having you use those credits when your instance's CPU usage is above the baseline. When your instance runs out of CPU credits, it slows down to a crawl and any web servers you host on it will timeout.
So the next question was: Do I need a bigger instance, or does one of my services use too many resources? I started by shutting down some services I didn't need anymore, and waited a while to see if that helped. But a few months later, the same thing happened again, so I started digging again.
CPU usage
The next thing I looked at was the CPU usage graph of the EC2 instance:
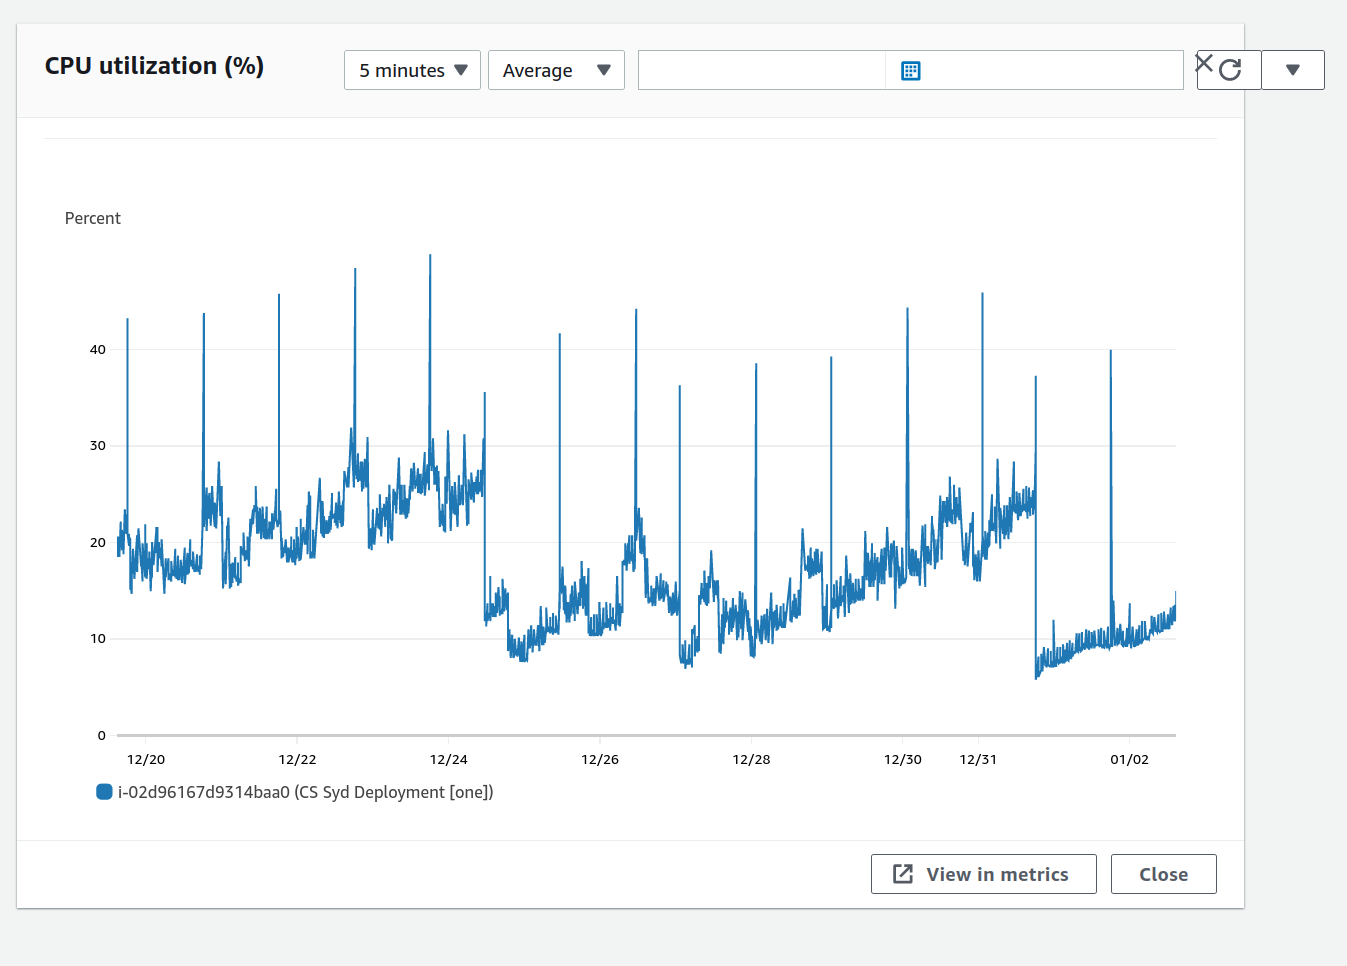
The first thing I saw were regular spikes. The spikes were so regular that I figured they'd have something to do with a looper that one of my services was running. They were nothing to worry about.
The much more worrying thing was the second thing I noticed: The overall trend of the CPU usage graph was upward. Over multiple days, the CPU usage would creep up over the baseline and start using up CPU credits. Even more days later, the CPU credits would run out and the server would start timing out.
I could not see the memory usage of the EC2 instance on any of the graphs, but all of my services are written in Haskell, so I knew that if there was a memory leak anywhere, this CPU usage pattern would make sense. I figured one of my services had a space leak somewhere, but I didn't even know which one yet.
I ran btop on my server and noticed that one of my services had the biggest memory footprint by far: salsa-party-web-server. At that point my hypothesis was clear: There is a memory leak in the Social Dance Today server.
Shotgun fix
I was short on time to work on this problem, so I figured I could have a look at the code and quickly identify potential problems. I had recently added a search result cache, so I figured that was a good place to begin looking.
The site caches every search query's results for a few hours. If the same search query is used a second time within that time, the cached results are shown instead of computing more recent ones. After that they become stale and should not be reused.
A looper that runs every few hours (the same period as the cache expiration duration) populates this cache ahead of time for commonly-searched locations like capital cities. This way the cache is already hot by the time a user searches for Social dance parties near Zurich.
The site uses cache to maintain a cache with keys of type SearchQuery to map to values of type SearchResult. I read the preamble of the documentation again, and lo and behold;
Note that items are not purged automatically in the background when they expire.
Organic searches were filling up the caches with search results, but these search results were never purged. Either they were refreshed when the same search was performed again, or the results expired in the cache. In either case, the cache only kept growing, as did memory usage.
So my quick fix was to add Cache.purgeExpired to the cache populator job and hope that that would fix things.
I monitored the CPU usage in the EC2 monitoring tab and saw that the problem was still not solved. Keep in mind that I was still rebooting the server every few days just to reset its memory usage.
Systemic diagnosis
A few weeks later I found myself without much work and figured I'd really dive into this problem and learn more about debugging space leaks.
Hint hint; wink wink; I'm looking for work. Hire me!
The Social Dance Today server consists of two main pieces.
Data ingestion
Web serving
My first idea was to turn off all data ingestion. This way I could narrow down my search area:
If the problem still occurred without data ingestion, then there was certainly a problem with the web server.
If the problem didn't occur anymore without data ingestion, then the problem was either in the combination of the server and the data ingestion or somewhere in the data ingestion.
I turned off all data ingestion and monitored my instance's CPU usage again. The problem was still occurring. I could see the memory use rise steadily by about 50MB/day in my log:
2023-01-01 18:15: 89M
2023-01-01 22:08: 102M
2023-01-02 13:53: 152M
2023-01-02 18:48: 158M
2023-01-03 00:24: 243M
This was great news, in some sense, because it had the clearest consequence: There was a space leak in the web server.
Pieces of the web server
The web server keeps very little state at all. I identified only:
Sqlite and whatever cache it holds
The
Apptype. All the fields are strict, so I only had to look at the non-constant-size types:data App = App { appStatic :: !EmbeddedStatic, appHTTPManager :: !HTTP.Manager, appConnectionPool :: !ConnectionPool, appSearchResultCache :: !SearchResultCache, appExploreResultCache :: !(Cache Coordinates Word), appOSMRateLimiter :: !(Maybe TokenLimiter), -- Nothing means disabled. -- [...] Constant size fields omittedhere }
I didn't really suspect Sqlite because it is amazing, but I quickly checked if maybe it had some weird defaults.
No. Sqlite has 2000KiB cache size by default. That wasn't it.
The EmbeddedStatic field contains static assets of the site. These don't change during the execution of the server, but who knows, maybe there was some sort of bug by which they get duplicated whenever they get fetched. That seemed unlikely, so I skipped this field.
The HTTP.Manager had a closed issue relating to a memory leak but in that issue it turns out that the problem wasn't in http-client. It also seemed quite unlikely to me that there'd be a memory leak in http-client that no one has noticed yet.
That left two potential suspects: cache's Cache, and token-limiter-concurrent's TokenLimiter.
Digging into libraries
At this point I was guessing that the problem might be in library code, rather than my own. I figured it would be easier to investigate the memory usage of a little example usage than of my entire web server, so I started there.
The token-limiter-concurrent library is one that I've written, so it was definitely the most suspicious candidate. Next I noticed that a TokenLimiter crucially contains an MVar of a tuple:
-- | A token bucket-based rate limiter
--
-- This token limiter is thread-safe and guarantees that:
--
-- * <https://en.wikipedia.org/wiki/Thundering_herd_problem There will be no thundering herd problem>
-- * <https://hackage.haskell.org/package/base-4.14.1.0/docs/Control-Concurrent-MVar.html#v:modifyMVar Fairness: Waiting processes will be serviced in a first-come first-service order.>
data TokenLimiter = TokenLimiter
  { tokenLimiterConfig :: !TokenLimitConfig,
    -- | The last time the limiter was used, and what the token count was at that time.
    --
    -- Not that this library assumes that you never put anything into this mvar
    -- yourself and only use the functions in this library to interact with it.
    tokenLimiterLastServiced :: !(MVar (MonotonicTime, Count))
  }
  deriving (Eq, Generic)
An MVar of a tuple is a classically smelly suspect for a space leak because MVars don't have to force their contents, and tuples can be matched on without necessarily evaluating the contents. So it was entirely possible that we were just accumulating a bunch of un-forced thunks that would evaluate to either side of that tuple.
Time for some graphs! How did that go again?
Profiling in Haskell
There are plenty of resources on how to diagnose space leaks in Haskell:
Unfortunately none of them really explain the pain you should expect to have to deal with. They all make it look like all the tools they use work brilliantly out of the box, and they don't. They have some strange idiosyncrasies that you have to know about. Here's what I learnt:
Enable profiling & use RTS options
You can't just have any executable spit out a nice heap profile graph, you need to specifically enable this. With stack you can do this with stack build my-exe --profile. Once you have your executable, you can start adding Runtime System (RTS) Options to make the executable spit out profiling data.
For example, you can add +RTS -p to have the executable spit out simple time profiling in my-exe.prof. Note that the executable has to exit before it spits out this data. It might already make the file, but it will be empty. The executable also won't print anything new.
You can can use the +RTS -p -s to also have the executable print out a summary of GC stats, but don't ask me how I know this because neither +RTS --help nor the user guide's section on profiling mention this.
Memory usage graphs
What we actually want is to produce some graph that show us memory usage. The user guide says we can use +RTS -hc to produce a heap profile: my-exe.hp.
When we do this with our code, the executable will happily start spitting out data in a my-exe.hp file even before it finishes. But note that the data in the file is delayed compared to the actual execution so you can't just make a graph of it and expect it to make sense. You need to let the executable finish first.
So how do you make these graphs? You can use hp2ps to turn the .hp file into a .ps file. Great! (I think hp2ps comes with GHC so it should just be available if you have ghc, but I have no idea where it actually comes from.)
If, like me, you're young enough to have no idea what a .ps file is; all you need to know is that it's a bit like an old-school .svg file. That is to say: it is the image. You should be able to open it with an image viewer somehow.
When I tried this, I fully expected this to all "just work". However, my graph looked like this:
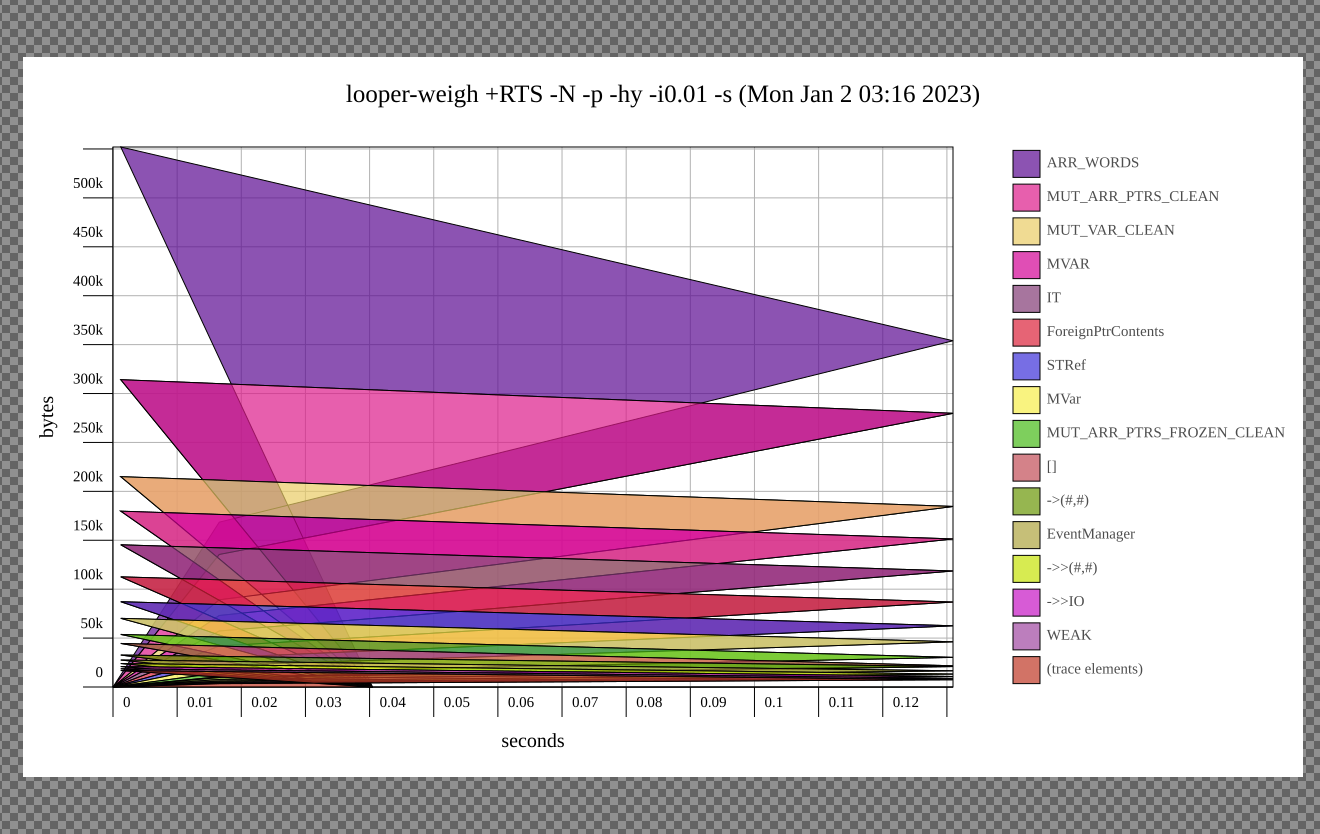
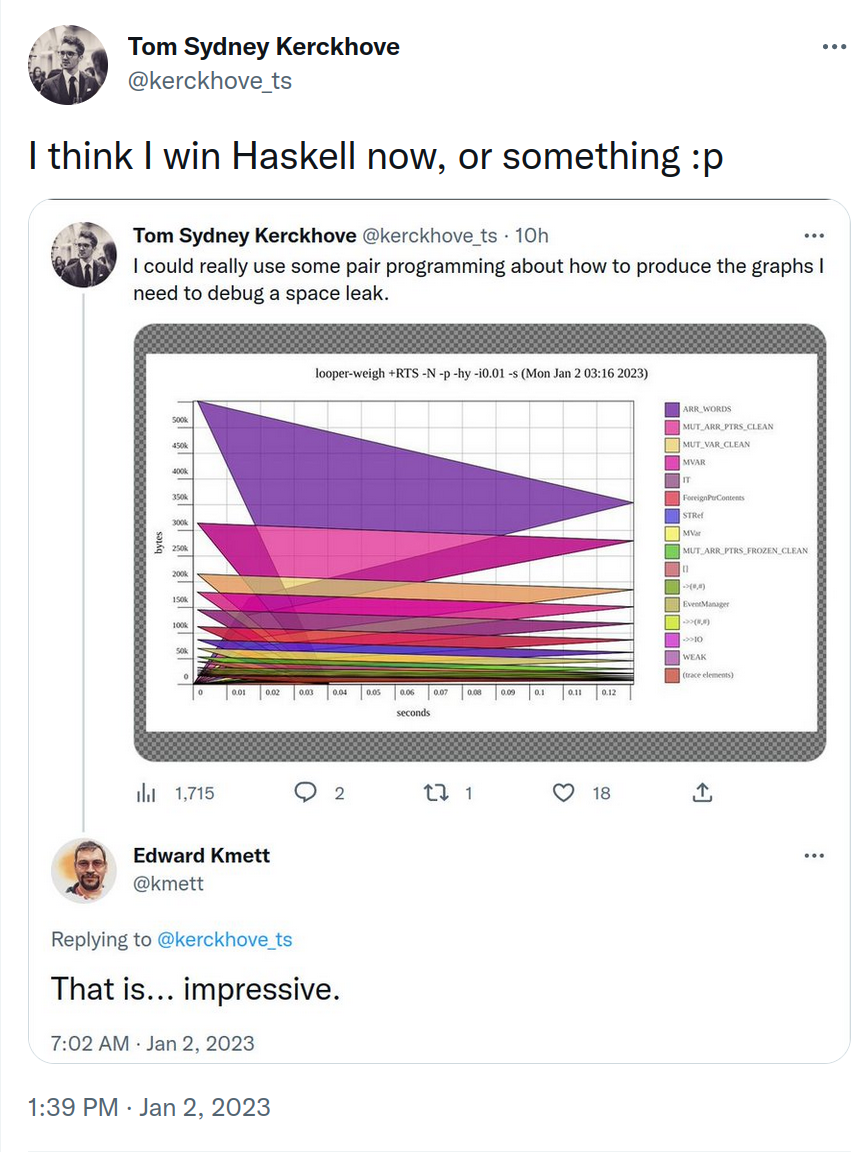
I probably just ran into some obscure bug on the first try (again), but I think this has something to do with not running the executable for long enough or not letting it finish. In any case, it even confused @kmett, which I'm very proud of.
(You can also use hp2pretty to produce an .svg directly but it has the same problems.)
Eventlog-based graphs
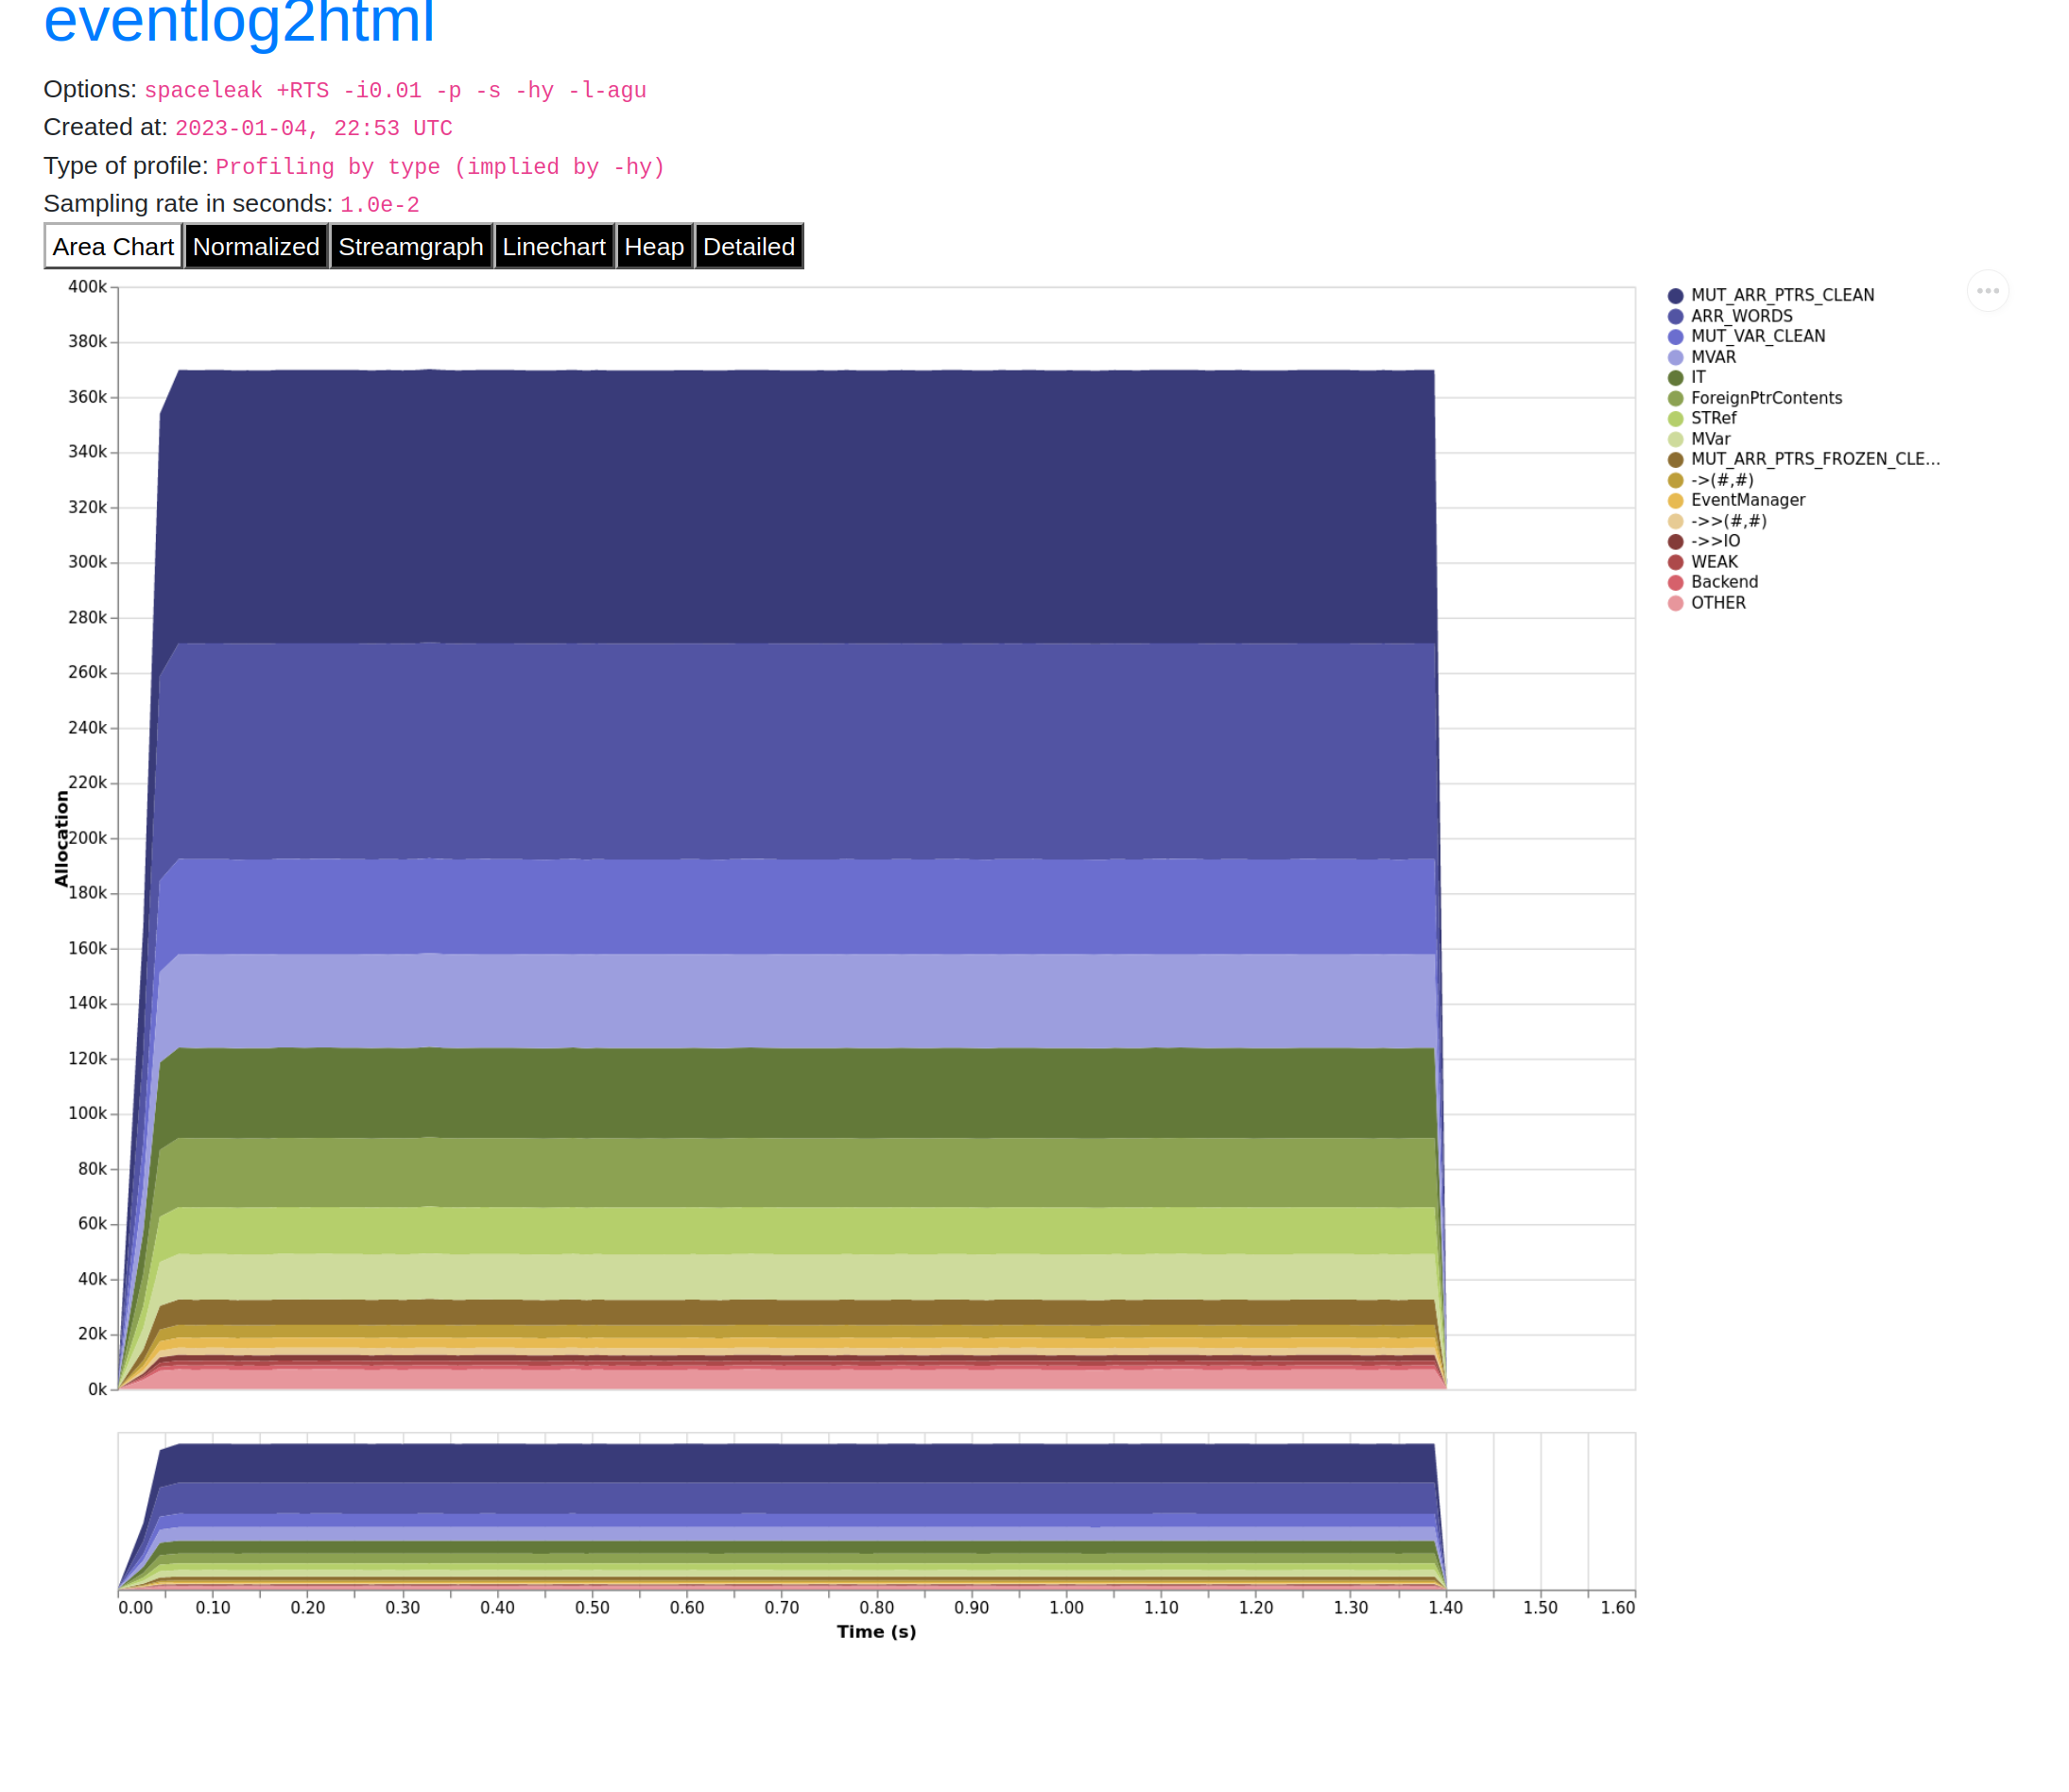
I didn't look into how to make graphs based on .hp files any further. It looks like this approach superseded? Nowadays we can use Haskell's eventlog options and eventlog2html to produce nice graphs that we can open in a browser.
The homepage of eventlog2html explains this quite well.
You add -l-agu to the RTS options, and you get a nice my-exe.eventlog file. -l is for eventlog (?), but don't ask me what -agu is. Again, this file will be filled up during execution, but won't really make much sense until after the execution finishes because there is a significant delay in the data. You can eventlog2html my-exe.eventlog to get my-exe.eventlog.html and open that with your browser.
When I did this, the graphs were completely empty. Again, I think I might not have run the executable for long enough or not let it finish. In any case, I tried adding -i 0.01 to get more frequent sampling. This way, I thought, even a shorter run would have some samples and not leave me with an empty graph. However, it turns out that this will not work. You need to use -i0.01 instead (?!). Don't ask me why, but go thumb up this issue if you agree that that's not a great UX.
Eventually I managed to get some nice graphs for a program I knew had a space leak:
main :: IO ()
main =
  let nums = [1..10000000 :: Int]
   in print $ fromIntegral (sum nums) / fromIntegral (length nums)
Digging into token-limiter-concurrent and cache
The token-limiter-concurrent library was the perfect candidate for the location of the space leak.
I wrote it myself.
The server uses it consistently but infrequently.
It uses an
MVarthat contains a tuple.
The server uses two of its API's functions: waitDebit and tryDebit. I wrote a little program that uses both of them a lot for about ten seconds, and lo and behold:
No space leak.
I tried the same for the cache library and also could not get it to exhibit a space leak. This meant I was forced to take another look at my server.
Luckily I now knew how to produce the graphs so I felt a renewed confidence that I would eventually figure it out.
Digging into salsa-party-web-server
I added profiling output to the web server, turned off the data ingestion and shortened the period of the search cache populator looper to 35 seconds. Then I ran the server until the cache populator had finished twice, waited a few seconds, and then ran the end-to-end test executable on it. This gave me the following graph:
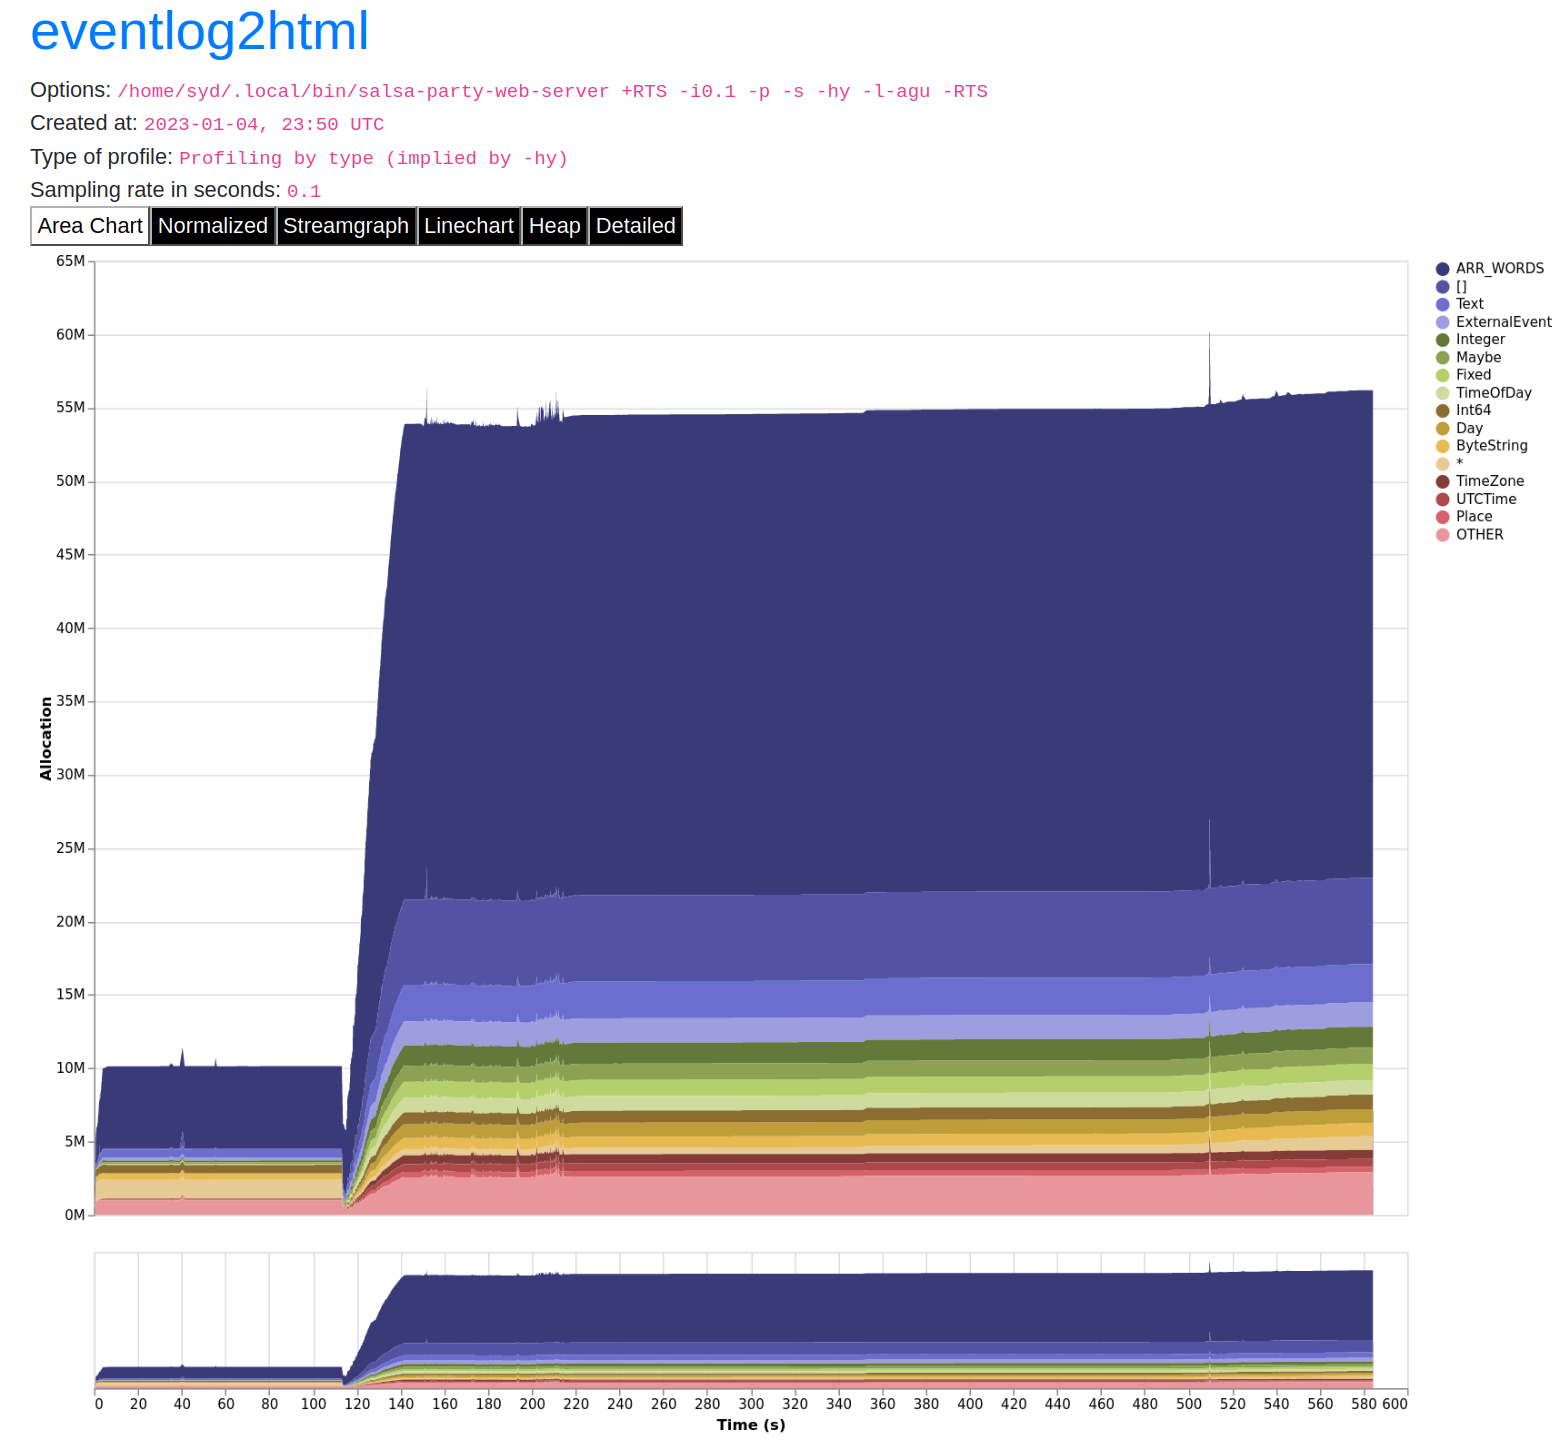
The first flat part of the graph is when we see the caches populated the first time. This behaves as expected. The spike happens when I run the end-to-end tests. The server adds lots of queries and results to the search cache. But then strangely, they don't seem to be removed when they are supposed to expire.
I had another closer look at the cache populator and saw this:
Cache.insert' searchResultCache Nothing query queryResults
Cache.purgeExpired searchResultCache
The expired are indeed being removed from the cache by Cache.purgeExpired correctly, but somehow the items must not actually be considered expired. Then I looked at the documentation of Cache.insert' and saw this:
-- | Insert an item in the cache, with an explicit expiration value.
--
-- If the expiration value is 'Nothing', the item will never expire. The
-- default expiration value of the cache is ignored.
insert' :: (Eq k, Hashable k) =>  Cache k v -> Maybe TimeSpec -> k -> v -> IO ()
I had supplied Nothing to the insert' function thinking that that would mean that the item would get the default expiration time, but instead it meant that the item would get no expiration time and would stick around forever. A more typed API would have helped with this:
data Expiration = NoExpiration | ExpireIn !TimeSpecBut what also would have helped is me actually reading the documentation.
Solution
I tried using Cache.insert instead of Cache.insert':
-  Cache.insert' searchResultCache Nothing query queryResults
+  Cache.insert searchResultCache query queryResults
Then I ran the same experiment again, and the space leak disappeared:
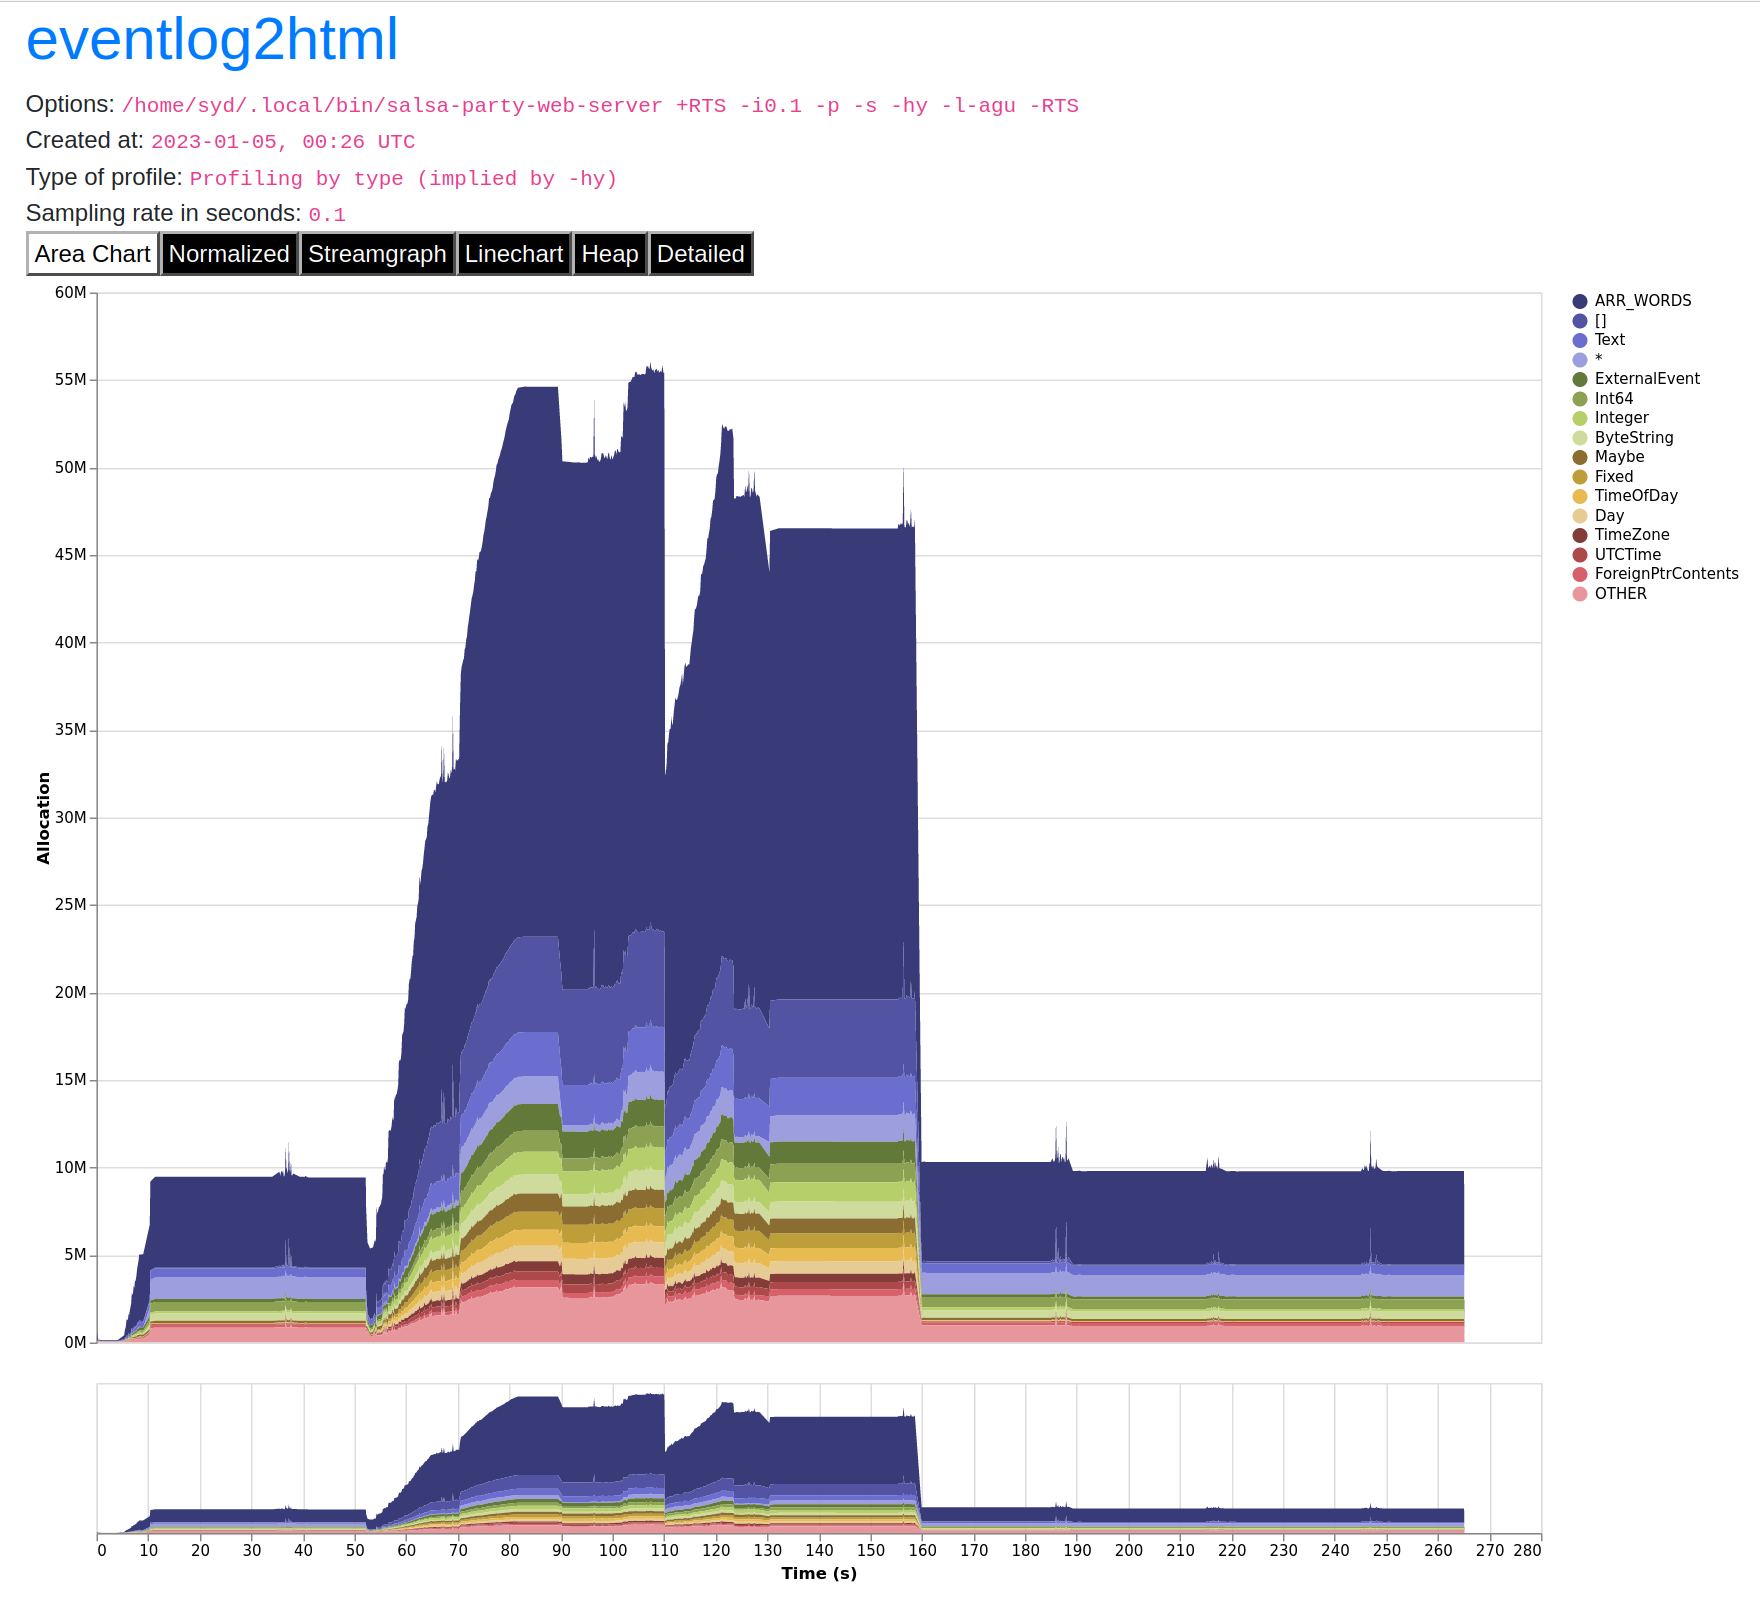
Now the expired items in the search cache were purged correctly and memory use came back down to around 10MiB.
Key takeaways
Have alarms in place for when your site goes down.
Hope is not a strategy.
Trust the scientific method.
Making nice heap profile graphs in Haskell is not difficult once you figure out which incantations to use.
Keep a journal of the entire investigation.
Have an E2E test suite that can simulate load on the server.
RTFM: The docs are there, read them.