I needed some graph visualizations for the chapter on logic and computability in The notes and I really didn't want to write about 20 pieces of repetitively constructed Graphviz code. Less than one week later, Haphviz allowed me to generate those graphs with only a few lines of Haskell code.
Disclaimer: This post assumes that you know how Graphviz' Dot language works. It is written at the time of Haphviz 0.1.4.
Demonstration
Divisors
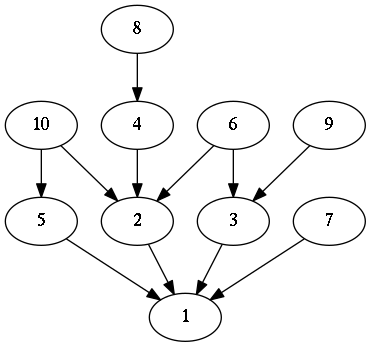
Ever since I've learned about lattices, I've wanted to generate a Hasse diagram of natural numbers with 'divides' as the partial order. Of course it's impossible to generate an infinite diagram but I would settle for a parametric arbitrarily big diagram.
We'll generate a node in the graph for every natural number starting from $1$. Now, as far as the maths go, there should be an edge between two nodes labeled $a$ and $b$ if $a$ is divisible by $b$ and there doesn't exist a node labeled $c$ that has edges from $a$ and to $b$.
As the math is not the focus of this post, let's see how you would generate code to visualize this graph with Haphviz.
renderToStdOut $ graph directed "divisors" $ do
    nodes <- forM [1..n] $ node . T.pack . show
    let ns = zip [1..] nodes
    sequence_ [ni --> nj | (i, ni) <- ns, (j, nj) <- ns, i > j, primary i j]
Here the primary :: Integer -> Integer -> Bool function determines wether there should be an edge between two nodes. That wasn't so hard, was it? Running dot on the generate graphiz code with n = 10 yields the following image.

Finite state automata.
Having a Turing-complete encoding system for graph visualization means that we can simplify the process of visualizing graphs with a predictable structure.
Haphviz has a module Text.Dot.FSA with a single function fsaGraph that allows you to easily generate graphs for finite state automata.
The following code generates Graphviz code for a simple finite state automaton.
renderToStdOut $ fsaGraph
            [a, b, c]                         -- States
            a                                 -- Starting state
            [b]                               -- Accepting states
            [(a, b, p), (b, b, q), (b, c, p)] -- Edges
  where (a, b, c, p, q) = ("a", "b", "c", "p" ,"q")
Design
The design of the internals of this library is based on the design of HaTeX internals. A single data type Dot represents the contents of a graph. Generating graphs by generating a Dot structure is certainly possible but it is a tad tedious.
The DotGen monad allows you to generate graphs in a simpler way. Now you only have to declare how you want to the graph to look and let the combinators take care of constructing a Dot graph.
Further work
Further extensions of this libraries are certainly possible. Here are some of such extensions I propose. Feel free to have a go at implementing them if you need them.
More predictable graph generation
As far as predictable graph generation goes, there is, at the time of writing, only support for finite state automata visualization in Haphviz For The notes, I made a similar piece of code that allowed me to generate Store-Heap model visualizations.
In future work on this library, code could be written to make visualizations of other predictable graphs easier:
Visualizations of trees from Data.Tree
Other automata from the domain of computability: Pushdown automata and Turing machines
...
A Graph type class
Data.Tree is just one example of a data type that could be represented as a tree. Others may well be visualizable too.
I propose a type class Graph a with a single function graph :: a -> DotGen () that generates its visualization.
A DotGen Monad transformer
DotGen is just a monad. It's currently not possible to do IO while generating a graph.
Writing a DotGenT m monad transformer would allow you to compose the graph generation monad with other monads like IO. This would be fairly trivial as DotGen is already a type synonym for StateT State (WriterT Dot Identity).